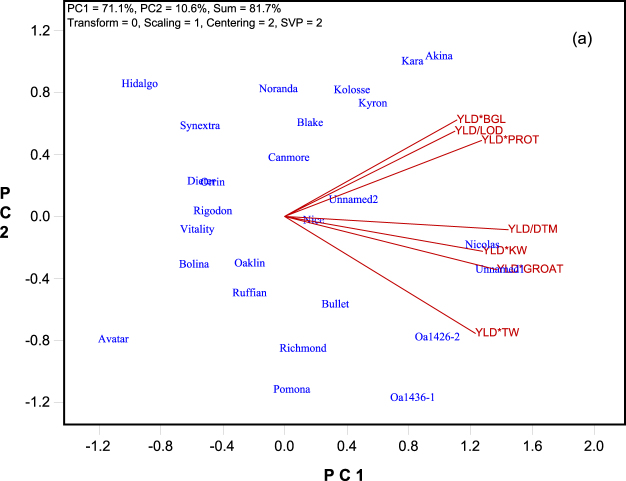
Figure 2.
The Tester Vector view of the genotype by yield*trait (GYT) biplot to show associations among the yield-trait combinations. The biplot was based on singular value decomposition of the standardized GYT table (“Scaling = 1, Centering = 2”). The trait-focused singular value partition (“SVP = 2”) was used. The trait codes are: BGL: β-glucan content; DTM: days to maturity; GROAT: groat content; KW: kernel weight; LOD: lodging score; PROTEIN: protein content; TW: test weight; YLD: grain yield.

