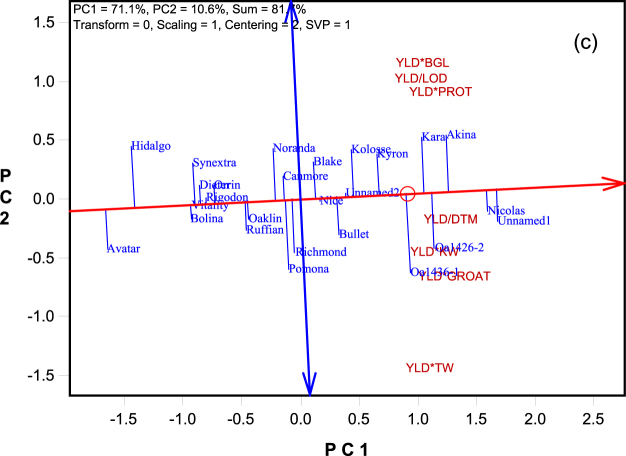
Figure 4.
The Average Tester Coordination view of the genotype by yield*trait (GYT) biplot to rank the the genotypes based on their overall superiority and their strengths and weaknesses. The biplot was based on singular value decomposition of the standardized GYT table (“Scaling = 1, Centering = 2”). The genotype-focused singular value partition (“SVP = 1”) was used. The trait codes are: BGL: β-glucan content; DTM: days to maturity; GROAT: groat content; KW: kernel weight; LOD: lodging score; PROTEIN: protein content; TW: test weight; YLD: grain yield.

