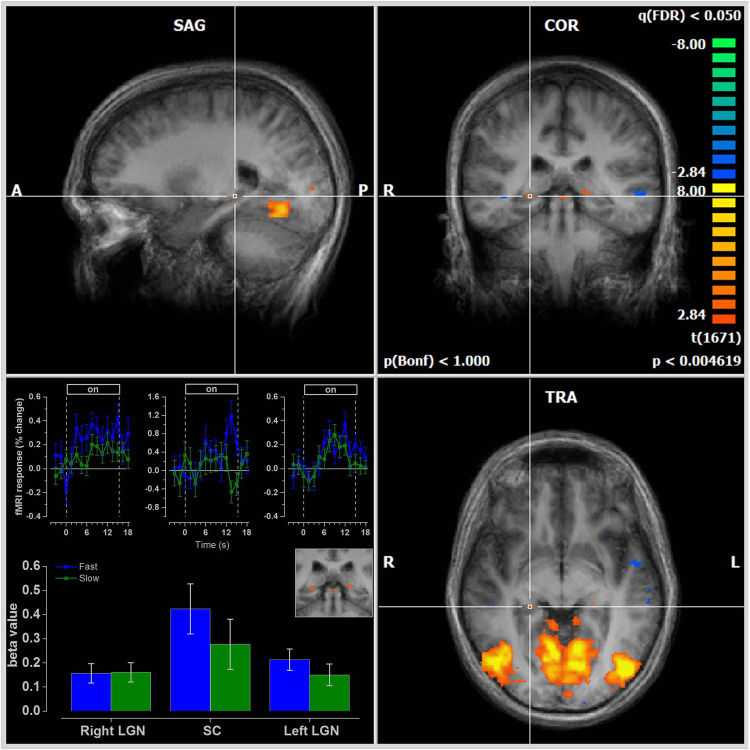
Figure 3.
Anatomical regions consistent with the position of the LGN (TAL - LH: X = 21, Y = −27, Z = −4; RH: TAL: X = 21 Y = −28 Z = −2) and the SC (TAL: X = −2 Y = −31 Z = −5) projected on an average anatomy respond equally well to both speeds (N = 7). The cross hairs indicate the right LGN. The average time-series for the LGN and SC are shown in the lower left panel. The bars plot the estimated β-values from multi-subject GLM analysis. The SC are most clearly seen in the inset in the lower left panel, above the bar plot.

