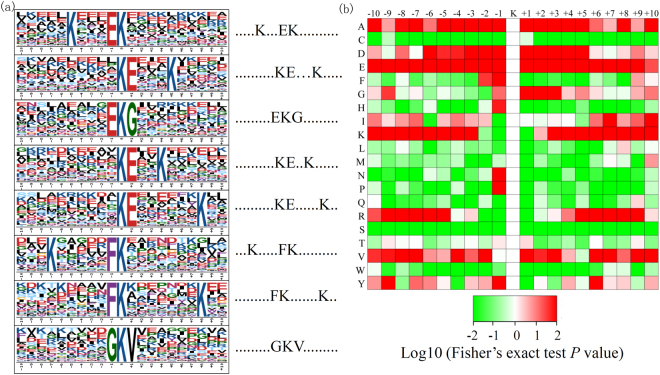
Figure 3.
Bioinformatic analysis of lysine crotonylation sites in papaya. (a) Plot shows relative abundance of amino acids flanking crotonylated lysine. The relative abundance was counted and schematically represented by an intensity map. The intensity map shows enrichment of amino acids in specific positions of crotonylated lysine (10 amino acids upstream and downstream of the crotonylation site). (b) Probability sequence motifs of crotonylation sites consisting of 10 residues surrounding the targeted lysine residue using Motif-X. Seven significantly enriched crotonylation site motifs were identified.

