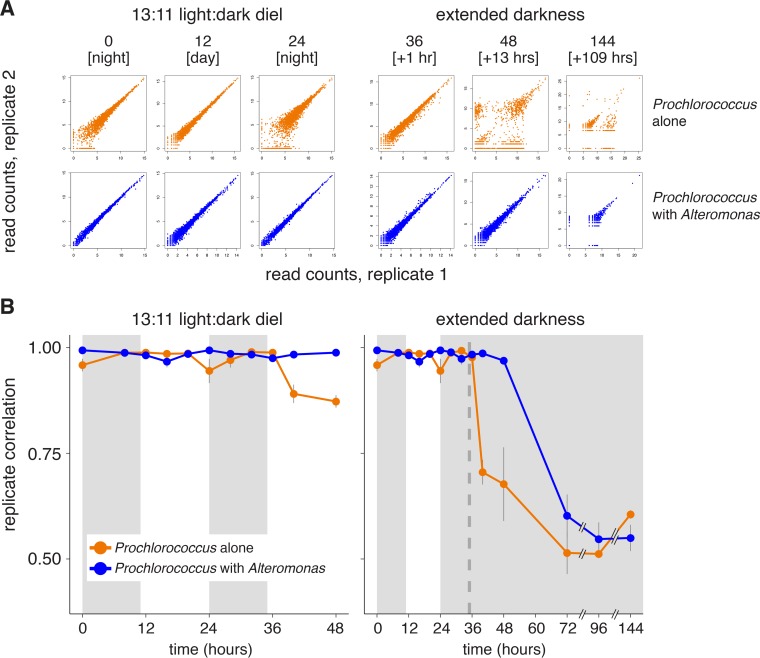
FIG 2 .
Impact of coculture on Prochlorococcus transcriptome replicate concordance. (A) Scatterplots comparing relative transcript abundance for each Prochlorococcus ORF (individual dots) between two replicates at the indicated time points for the axenic (orange) or cocultures (blue) (see also Fig. S2 for all pairwise combinations). Read counts were log transformed. Values in brackets indicate either the time of day during the day or the number of hours under extended darkness. (B) Spearman correlation of transcriptome replicates (such as those shown in panel A) at each time point. Values indicate the means (± SD) of all possible pairwise combinations of the three replicates. The dashed vertical line indicates the time of “expected” sunrise for cultures kept in the dark.

