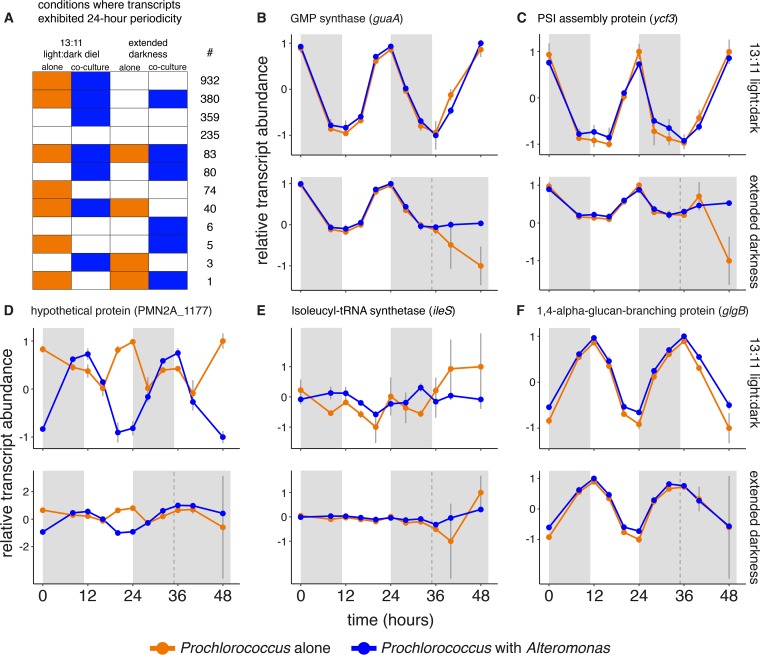
FIG 4 .
Impact of coculture on Prochlorococcus periodic transcriptional oscillation patterns during normal diel light and extended darkness. (A) Number of Prochlorococcus transcripts exhibiting significant 24-h periodicity under different experimental conditions. Colored boxes indicate cultures where transcript abundance was periodic; white boxes represent conditions where transcripts were not significantly periodic. (B to F) Representative transcript abundance profiles for the five most frequently observed groups shown in panel A. Plots show normalized relative transcript abundance under the 13:11 diel L:D cycle (top plot) or after the shift into extended darkness (bottom plot). The treatment of cells is indicated as follows: cells grown with light (white background) and cells grown in the dark (gray-shaded regions). The dashed vertical line indicates the time of the “expected” sunrise for the cultures kept in the dark. Values are means (± SD) for three biological replicates.

