Figure 8.
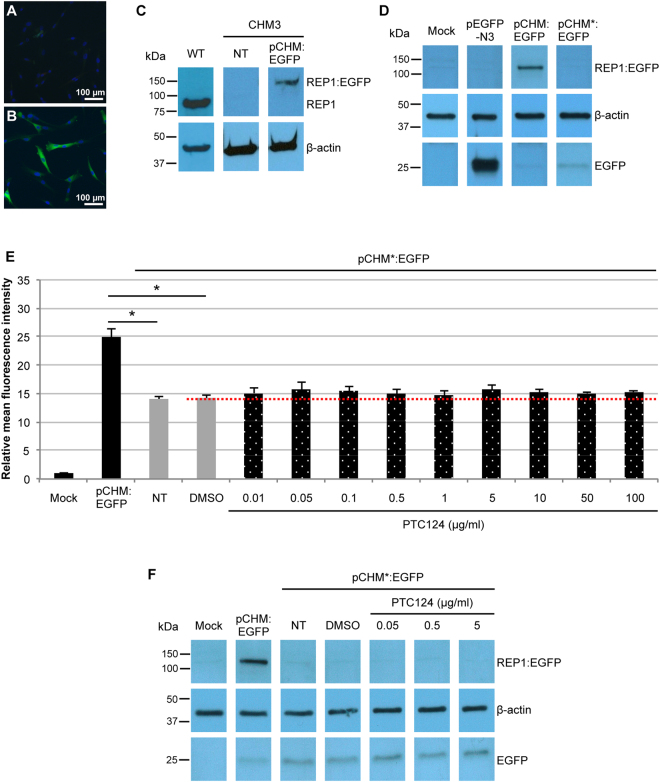
Effect of PTC124 treatment on a UAA-mutated CHM overexpression system. Immunofluorescence studies with an anti-GFP antibody of mock-transfected (A) and pCHM:EGFP-transfected (B) CHM3 fibroblasts showing EGFP expression (in green; nuclei in blue). (C) Western blot analysis of transfected CHM3 fibroblasts using an anti-REP1 antibody. An ~90 kDa REP1 band is detected in wild-type (WT) cells but not in mock-transfected cells. A larger (~120 kDa) REP1:EGFP band is seen in pCHM:EGFP-transfected cells. β-actin serves as a loading control. The WT and CHM3 lanes were cropped from two different gels. (D) Western blot analysis of transfected COS-7 cells using an anti-EGFP antibody. No signal can be detected in mock-transfected cells. An ~25 kDa EGFP band can be detected in cells transfected with the empty pEGFP-N3 plasmid. An ~120 kDa REP1:EGFP band is seen in pCHM:EGFP-transfected cells but not in pCHM*:EGFP-transfected cells; a faint ~25 kDa EGFP band is detected in both. Bands were cropped from the same gel with different exposure times for EGFP and β-actin. (E) Flow cytometry analysis of the mean fluorescence intensity of transfected COS-7 cells treated with various doses of PTC124. A 25- and 14-fold increase in fluorescence is seen in cells transfected with pCHM:EGFP (black bar) and pCHM*:EGFP (grey bars), respectively, as compared to mock-transfected cells. There was a significant 1.8-fold difference in intensity in non- and DMSO-treated pCHM*:EGFP-transfected cells as compared to pCHM:EGFP-transfected cells. Data are expressed as mean ± SEM, n = 2; Mann and Whitney test *p < 0.05. These levels did not significantly increase following PTC124 treatment (dotted bars) as compared to DMSO-treated controls (red dotted line); Kruskal-Wallis test p > 0.05. NT = non-treated. (F) Western blot analysis of transfected COS-7 cells following treatment with PTC124 using an anti-EGFP antibody. No signal is detected in mock-transfected cells. An ~120 kDa REP1:EGFP band is seen in pCHM:EGFP-transfected cells but not in non-treated (NT), DMSO-treated or PTC-124-treated pCHM*:EGFP-transfected cells. An ~25 kDa EGFP band is detected in all transfected cells, which is more intense for the pCHM*GFP-transfected cells. β-actin serves as a loading control. Bands were cropped from the same gel with different exposure times for β-actin.

