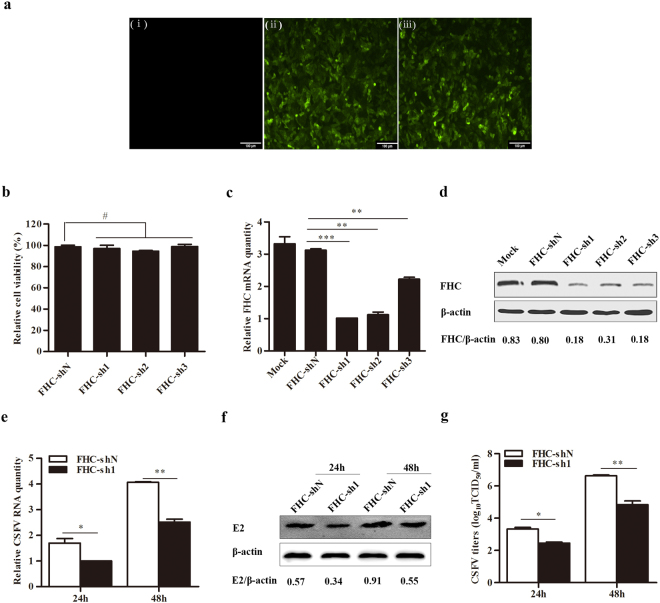
Figure 3.
Knockdown of FHC decreases CSFV propagation. (a–d) Knockdown of FHC in PK-15 cells by shRNA. (a) Confirmation of lentivirus infection with the GFP reporter expressed in PK-15 cells by fluorescence detection (×100). (i) Mock-infected PK-15 cells. (ii) PK-15 cells infected with lentiviruses expressing shN. (iii) PK-15 cells infected with FHC-knockdown lentiviruses. (b) PK-15 cells were treated with lentivirus-based shRNA to knockdown FHC; 50 μl MTT was added to each well and incubated at 37 °C for 4 h, followed by absorbance measurement at 570 nm using a microplate reader. The mean relative cell viability of three separate experiments is shown. (c) RT-qPCR analysis of FHC mRNA levels in FHC-knockdown cells. (d) Western blotting and densitometry for FHC protein levels in FHC-knockdown cells. (e–g) Analysis of CSFV growth rates in FHC-sh1 and FHC-shN cell lines. (e) RT-qPCR analysis of CSFV RNA levels in FHC-sh1 and FHC-shN cell lines. (f) Western blotting and densitometry for E2 protein levels in FHC-sh1 and FHC-shN cells. (g) The titers of progeny CSFV in FHC-sh1 and FHC-shN cell lines were detected by IFA, and the average data are shown. Relative FHC mRNA and CSFV RNA levels were analyzed by RT-qPCR and normalized to β-actin levels. FHC protein expression was analyzed by Western blotting and densitometry, the densitometric FHC/β-actin or E2/β-actin ratios are shown under the blots. All RT-qPCR and IFA assays were carried out in triplicate. Full-length blots (d and f) are presented in Supplementary Figure S3. The results are shown as the mean ± SD (n = 3). *P < 0.05; **P < 0.01; ***P < 0.001; #, not significant (P > 0.05).

