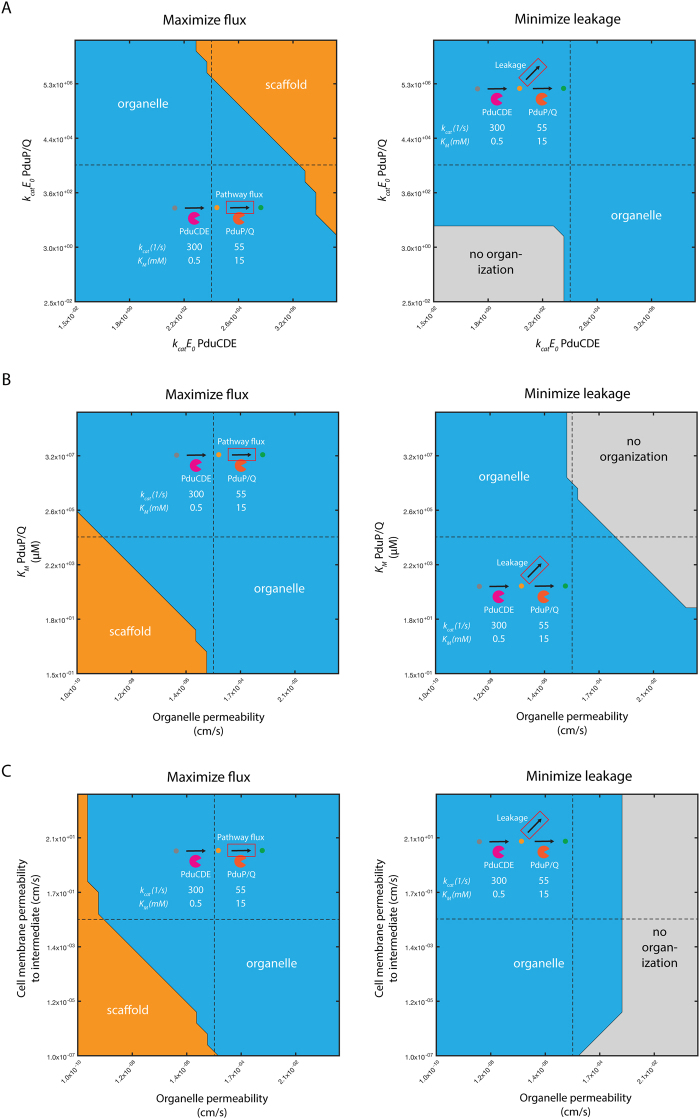
Figure 4.
Recommended organization strategy resulting in (left) maximum pathway flux or (right) minimum intermediate leakage for native Pdu metabolism as a function of (A) kcatE0 of PduCDE and PduP/Q, (B) organelle permeability and KM of PduP/Q, and (C) organelle permeability and cell membrane permeability. Regions of parameter space are colored by the optimal organization strategy in that region: organelle (blue); scaffold (orange); or no organization (grey). Baseline parameter values are shown with a black dashed line.

