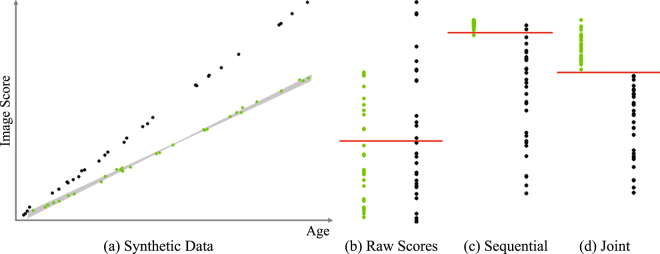
Figure 1.
Synthetic example. (a) Raw image scores of minimal drinkers (green) and regular drinkers (black). Each group consisted of 30 samples with ages randomly chosen between 17 and 21 years. The gray region indicates the solution space for the optimal regression line defining the GAM mode. (b) Classification based on raw scores did not accurately distinguish the two groups (red line). (c) Removing age-effects from the raw scores via GAM clearly separated both groups with only a few mislabeled sample points, and (d) classification using the joint method resulted in perfect group separation.

