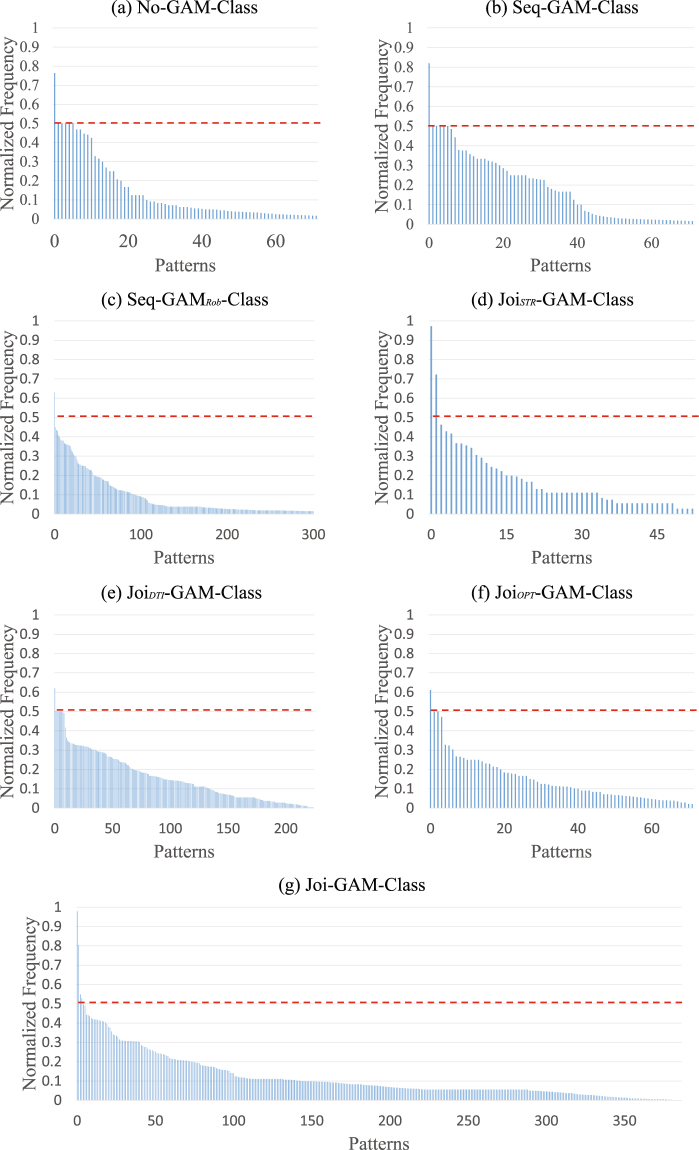
Figure 2.
Normalized frequency of patterns selected by each implementation (across all training runs). Unique patterns identified by each approach (x-axis), sorted in descending order according to their normalized frequency (y-axis). A pattern is a set of regional metrics that our method deemed informative for distinguishing regular drinking adolescents from minimal ones. Patterns were labeled as ‘dominant’ if their frequency was above a ‘red dashed line’ threshold (i.e., they appeared in more than 50% of suitable runs). While the curve defined by the normalized frequency across all patterns quickly dropped off for all implementations, Joi-GAM-Class had the highest number of dominant patterns. These results indicate that Joi-GAM-Class identified informative patterns across runs more consistently than any other implementation.

