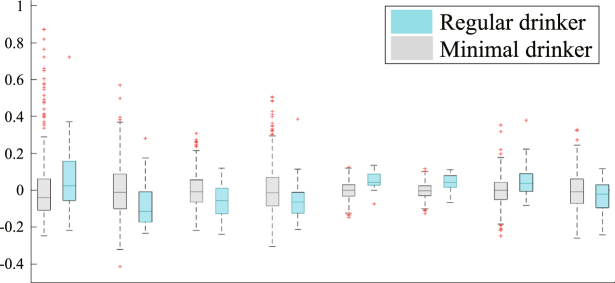
Figure 4.
Box plots of the residual scores of the brain regions selected by the informative patterns of Joi-GAM-Class. The central line in the box is the median, the two edges are the 25th and 75th percentiles, the whiskers extend to one-and-a-half times the interquartile range, and red pluses are the outliers. Regional scores marked in bold were significantly different between the regular drinking and minimal alcohol exposed group (p ≤ 0.002).

