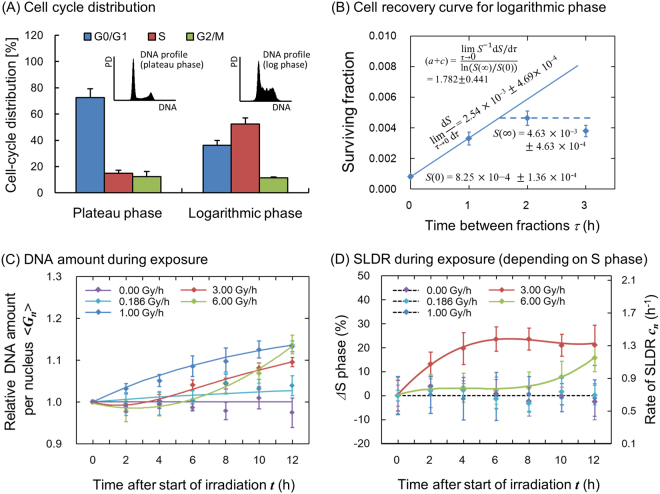
Figure 3.
Cell condition (DNA profile and SLDR rate) input into the present model. (A) shows DNA profile and cell-cycle distribution for plateau and logarithmic growth phase in CHO-K1 cell line, (B) shows procedure to deduce the rate of SLDR for logarithmic growth phase, (C) and (D) show the change of average DNA amount per nucleus and SLDR rate during protracted exposure, respectively, for various dose-rates. In Fig. 3B, a split-dose cell recovery data (5 Gy + 10 Gy) was taken from ref.33 and we deduced (a + c) value based on Eq. (21) from dS/dτ, S(0) and S(). Here the data for 0.0, 0.186 and 1.0 Gy/h were taken from our previous investigation12. In Fig. 3C,D, whilst the symbols represent measured mean DNA contents and variation of S-phase fraction, the lines are the interpolated curve by spline. The constant rates for the exposure to 0.0, 0.186 and 1.0 Gy/h of SLDR were adopted because there is no significant change of S-phase fraction.

