FIG 1.
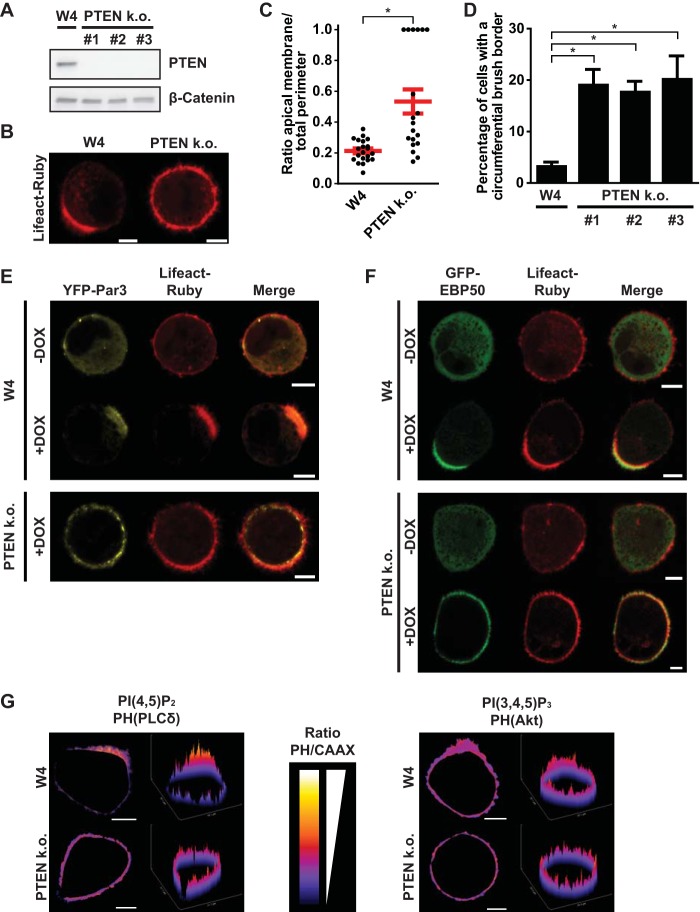
PTEN knockout (k.o.) W4 cells cannot restrict apical membrane formation. (A) Western blot of W4 cell and PTEN k.o. cell lysates probed for PTEN and β-catenin. (B) Localization of the actin marker Lifeact-Ruby in polarized W4 cells and PTEN k.o. cells. Scale bars, 5 μm. (C) Quantification of apical membrane size in doxycycline-stimulated W4 cells and PTEN k.o. cells. Red bars represent the average. Error bars represent the standard error of the mean (SEM) (n > 19). *, P < 0.05 using independent sample t tests. (D) Quantification of the fraction of cells that form an apical plasma membrane that covers the entire cell perimeter in W4 cells and PTEN knockout cells based on GFP-EBP50 and Lifeact-Ruby localization. Error bars represent SEM in three experiments (n > 100 cells per experiment). *, P < 0.05 using independent sample t tests. (E) Localization of the apical determinant YFP-Par3 and Lifeact-Ruby in unpolarized (−DOX) and polarized (+DOX) W4 cells and DOX-treated PTEN k.o. cells. Scale bars, 5 μm. DOX, doxycycline. (F) Localization of the brush border marker GFP-EBP50 and Lifeact-Ruby in unpolarized (−DOX) and polarized (+DOX) W4 cells and PTEN k.o. cells. Scale bars, 5 μm. (G) Ratio images and surface plots of PH-PLCδ-RFP/GFP-Kras(CAAX) [reflecting PI(4,5)P2 distribution] (left) and PH-Akt-GFP/RFP-Kras(CAAX) [reflecting PI(3,4,5)P3 distribution] (right) in polarized W4 and PTEN k.o. cells. Scale bars, 5 μm.

