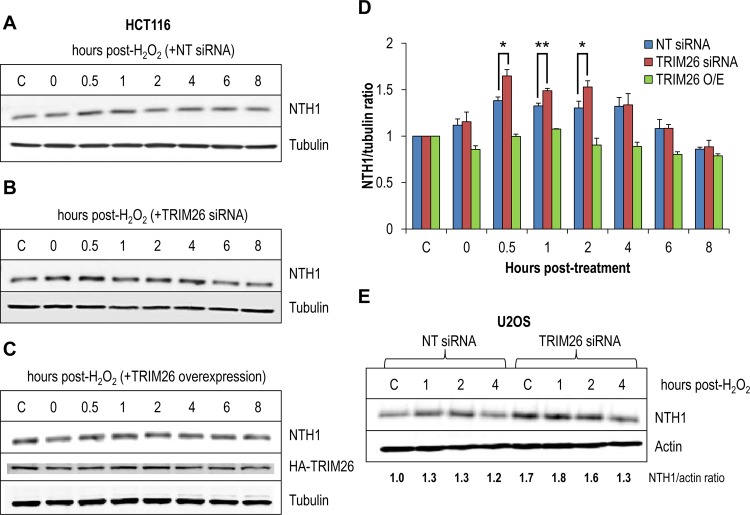
FIG 6.
Cellular NTH1 protein levels are induced in response to oxidative stress controlled by TRIM26. (A and B) HCT116 cells were grown in 10-cm dishes for 24 h to 30 to 50% confluence and then treated with Lipofectamine RNAiMax transfection reagent (10 μl) in the presence of 800 pmol NT siRNA (A) or TRIM26 siRNA (Β) for 72 h. (C) HCT116 cells were also grown in 10-cm dishes for 24 h to ∼90% confluence and then treated with Lipofectamine 2000 transfection reagent (10 μl) in the presence of a mammalian expression plasmid for TRIM26 (1 μg) for 24 h. Cells were either left untreated (lane C) or treated with hydrogen peroxide (150 μM for 15 min) and harvested at various time points following incubation. Whole-cell extracts were prepared and analyzed by 10% SDS-PAGE and immunoblotting with the indicated antibodies. (D) Levels of NTH1 protein relative to tubulin were quantified from the results of at least three independent experiments. Shown is the mean NTH1/tubulin ratio with standard error normalized to that of the untreated control, which was set to 1.0. *, P < 0.05; **, P < 0.02 as analyzed by a one-sample t test of ratios at the respective time points comparing NT control siRNA- and TRIM26 siRNA-treated cells. (E) U2OS cells were grown in 10-cm dishes for 24 h to 30 to 50% confluence and then treated with Lipofectamine RNAiMax transfection reagent (10 μl) in the presence of 200 pmol NT siRNA or TRIM26 siRNA for 72 h. Cells were either left untreated (lane C) or treated with hydrogen peroxide (150 μM for 15 min) and harvested at various time points following incubation, and whole-cell extracts were prepared and analyzed by 10% SDS-PAGE and immunoblotting with the indicated antibodies. Levels of NTH1 protein relative to actin were quantified from at least three independent experiments.

