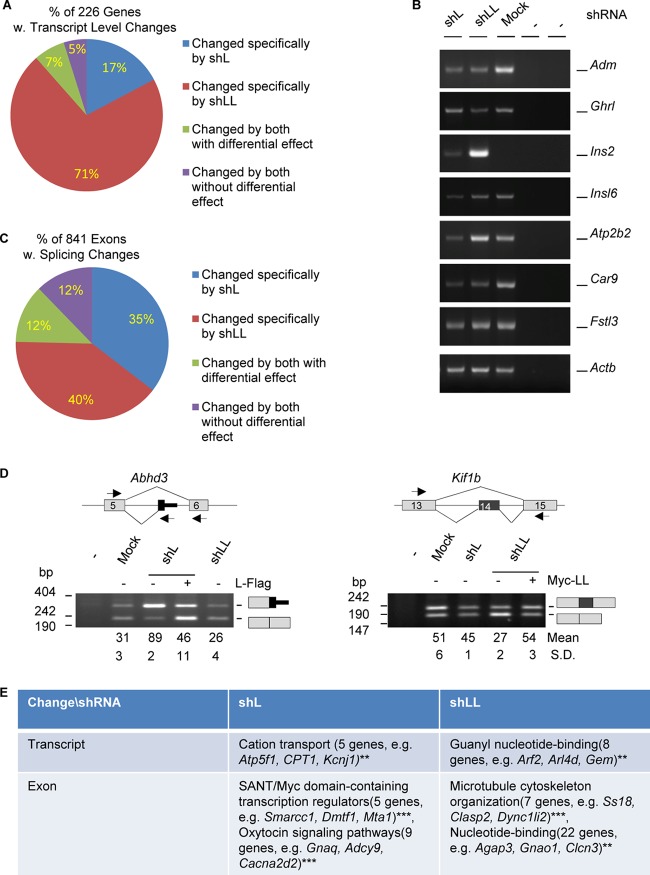
FIG 2.
Profiles of transcripts and alternative exons controlled by hnRNP L and LL in GH3 cells. (A) Pie-shaped percent distribution of genes with fold changes of less than 0.5 or more than 2.0 (P < 0.05) and average read numbers of at least 50. (B) Representative agarose gels of RT-PCR products of a group of hormone or hormone-related genes differentially expressed in the knockdown samples. Adm, adrenomedullin; Ghrl, ghrelin; Ins2 e3, insulin 2, exon 3; Insl6, insulin-like 6; Atp2b2, ATPase, Ca2+ transporting, plasma membrane 2; Car9, carbonic anhydrase 9; Fstl3, follistatin like 3; Actb (beta-actin), RNA loading control; −, PCR or RT negative control. (C) Pie-shaped percent distribution of alternative exons changed by shL, shLL, or both. (D) Examples of alternative exons specifically changed by shL or shLL. Lines, introns; gray boxes, constitutive exons; black boxes, alternative exons; arrows, PCR primers; Abhd3, abhydrolase domain containing 3; Kif1b, kinesin family member 1b. (E) DAVID function clustering analysis of the most significantly clustered functions of genes changed at transcript or exon levels specifically by shL or shLL. **, P < 0.01; ***, P < 0.001.

