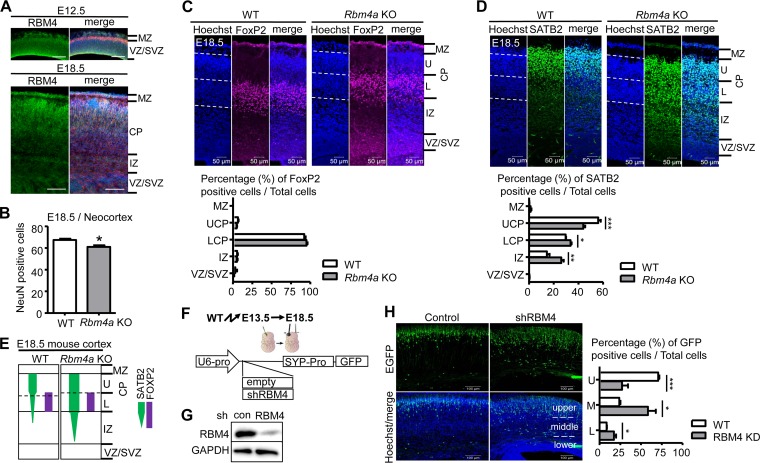
FIG 1.
RBM4 deficiency affects the radial migration of neurons during cortical development. (A) RBM4 expression in the developing mouse cerebral cortex. Immunostaining was performed on coronal sections of each mouse E12.5 and E18.5 brain using anti-RBM4 (green). Merged images include immunostaining with anti-RBM4 (green) and anti-Tuj1 (red) and Hoechst staining (blue). MZ, marginal zone; CP, cortical plate; VZ, ventricular zone; SVZ, subventricular zone; IZ, intermediate zone. Scale bar, 100 μm. (B) The bar graph shows data for NeuN-positive cells in the coronal sections of mouse E18.5 brain neocortex. (C and D). Coronal sections of E18.5 Rbm4a knockout and wild-type neocortex were stained with the neuronal layer-specific markers FoxP2 (layers V and VI) (C) and SATB2 (layers II to V) (D) and with Hoechst, as indicated. Scatter plot vertical graphs, respectively, represent percentages of FoxP2- and SATB2-positive neurons in cortical layers. Cortical layers are essentially labeled as described in panel A. UCP and LCP represent upper and lower cortical plates, respectively. (E) Summary of the effect of RBM4 deficiency in neuronal migration. (F) Schemes show the strategy for in utero electroporation (IUE) using the shRBM4-containing or empty (control) EGFP expression vector; expression was driven by the U6 promoter (U6-pro; for shRNA) and synaptophysin promoter (SYP-pro; for EGFP). (G) The knockdown efficiency of RBM4 was examined by transfection of the control or shRBM4 vector into HEK293 cells; immunoblotting was performed using antibodies against RBM4 and GAPDH. (H) The vectors were each injected into the lateral ventricle of each E13.5 brain, followed by electroporation. Brains were harvested at E18.5 for analysis. Representative images of IUE show EGFP (green) and Hoechst stain (blue). The bar graph shows the ratios of GFP-positive cells to total cells in three arbitrarily dissected cortical layers. *, P < 0.05; **, P < 0.01; ***, P < 0.001. WT, wild type.

