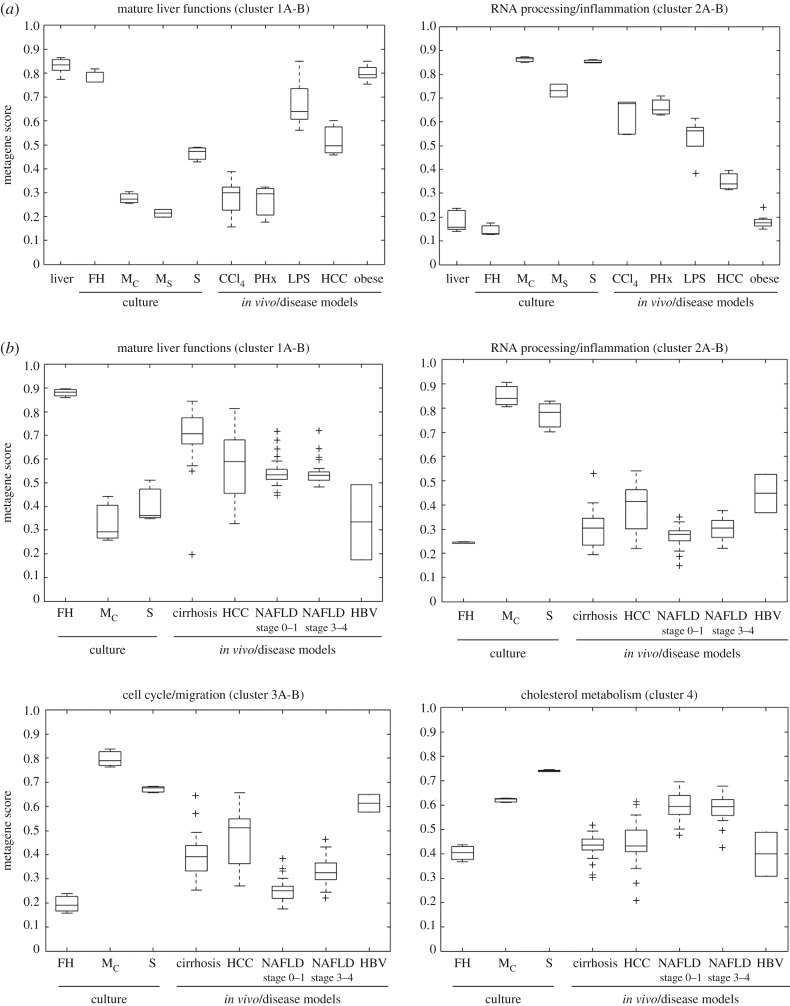
Figure 5.
Characterization of cells and tissues by metagene scores, where the metagene scores are an artificial variable for all genes within a specific cluster representing a specific biological function. The calculation of the metagene score is based on the median of the scaled gene expression and the resulting value distribution of the metagene score is represented as a boxplot. The bottom and the top of a box represent the first and third quartiles of the distribution and the whiskers mark the most extreme values within 1.5 times of interquartile of the ends of the box. (a) Mouse hepatocytes and liver tissue; (b) human hepatocytes and liver tissue. FH, freshly isolated hepatocytes; Mc, hepatocytes cultivated as monolayers in a confluent state; Ms, hepatocytes cultivated as monolayers in a subconfluent state; S, hepatocytes cultivated as sandwich cultures; CCl4, mouse liver tissue after acute CCl4 intoxication; PHx, mouse livers after two-thirds hepatectomy; LPS, mouse livers after acute intoxication with lipopolysaccharide; HCC, hepatocellular cancer; obese, steatotic livers of leptin-deficient mice; cirrhosis, human cirrhotic liver tissue; NAFLD, human liver tissue of patients with non-alcoholic fatty liver disease; HBV, human liver tissue of patients with hepatitis B virus infection (from Godoy et al. [24]).

