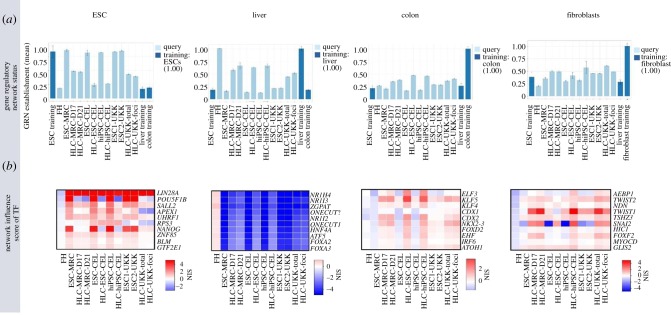
Figure 6.
Analysis of the same samples shown in figure 2 by GRN approach. (a) GRN status for different cell and tissue types (ESCs, liver, colon and fibroblasts). Error bars represent standard error of the mean value for each tissue identity, for three replicas analysed for each sample. (b) Network influence score (NIS) of transcription factors (TF) for the individual GRNs (from Godoy et al. [23]).

