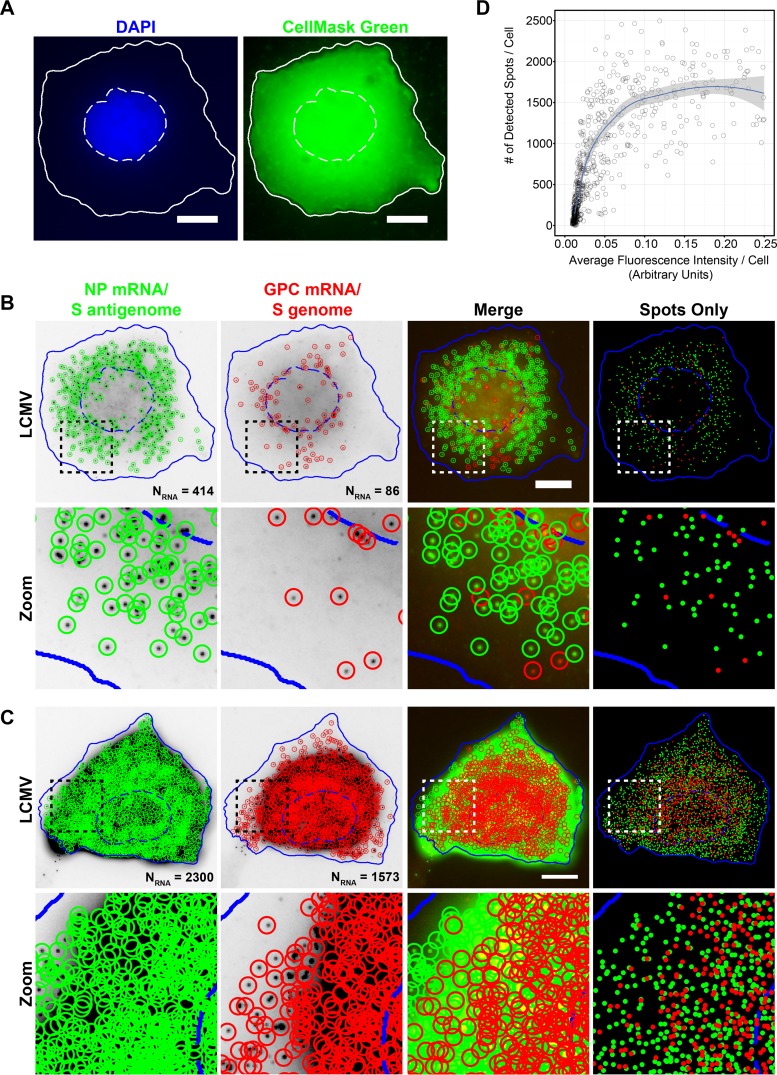
FIG 4.
Automated detection and quantitation of LCMV RNAs labeled with spectrally distinct fluorophores. (A) Cell nuclei and cytoplasms were automatically segmented by using focus-based projections of DAPI (nuclei) or CellMask green (cytoplasm) z-stacks acquired through the thickness of the cell. Note that pixel intensities of the CellMask green projection displayed here have been log transformed to aid visualization. Nuclear (hatched lines) and cytoplasmic (solid lines) boundaries are shown in white. Bar, 10 μm. (B and C) Maximum-intensity projections of LCMV-infected cells were fixed 24 hpi and stained with smFISH probe sets for the NP mRNA/S antigenome (Cy5) (green) and GPC mRNA/S genome (A568) (red). The boxed region of each cell is magnified and shown in the row labeled “Zoom.” Cells were segmented based on DAPI and CellMask green staining (see panel A), and spots were detected and localized in 3D by using FISH-quant. Individually detected RNAs are circled in green (NP mRNA/S antigenome) or red (GPC mRNA/S genome). The “Spots Only” column shows only the positions of the detected spots in relation to the cell boundaries defined by segmentation. Nuclear (hatched lines) and cytoplasmic (solid lines) boundaries are shown in blue. The same intensity levels for a particular probe set were applied to both images of LCMV-infected cells to permit comparisons. Bar, 10 μm. (D) Scatter plot showing the relationship between the fluorescence intensity in the smFISH channel in the maximum-intensity projection of smFISH images and the number of smFISH spots detected by FISH-quant for LCMV-infected cells fixed at 24 hpi and stained with the Cy5-labeled smFISH probes specific for the NP mRNA/S antigenome.

