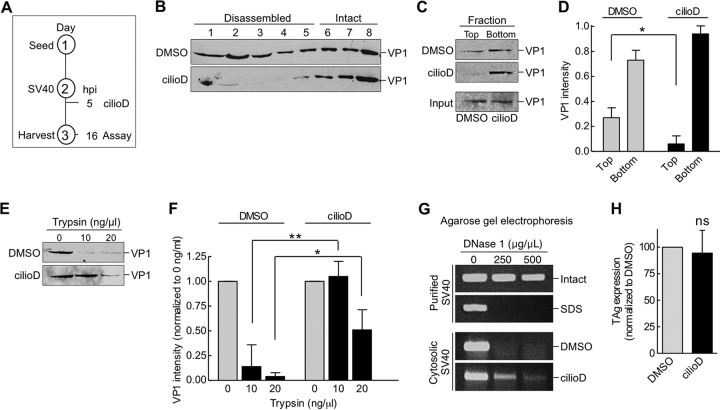
FIG 5.
Dynein disassembles cytosol-localized SV40. (A) Depiction of the experimental setup used in panels B to F. (B) CV-1 cells were infected with SV40, and at 5 hpi, cells were treated with DMSO or 100 μM cilioD. At 16 hpi, cells were harvested, and SV40 in the cytosolic fraction was isolated. The cytosolic fraction was layered over a discontinuous 20%-to-40% sucrose gradient. After centrifugation, fractions were collected and were analyzed for the presence of VP1 by immunoblotting. (C) The cytosolic fractions analyzed in panel B were layered over a 20% sucrose cushion and were centrifuged, and the top and bottom fractions were collected. (D) The relative intensities of the VP1 bands shown in panel C were quantified. Values are averages of the means (n = 3) ± SD. *, P < 0.05. (E) The cytosolic fractions analyzed in panel B were treated with trypsin at the indicated concentrations. Samples were subjected to SDS-PAGE, followed by immunoblotting with an antibody against VP1. (F) The relative intensities of the VP1 bands shown in panel E were quantified. Data were normalized to those for DMSO (control). Values are averages of the means (n = 3) ± SD; *, P < 0.05; **, P < 0.01. (G) Intact and SDS-treated SV40, and the cytosol-localized SV40 shown in panel B, were incubated with increasing concentrations of DNase I. DNA was subjected to PCR amplification and was analyzed by agarose gel electrophoresis. (H) CV-1 cells transfected with the SV40 genome were treated with DMSO or 100 μM cilioD. At 24 hpi, cells were fixed and were immunostained for TAg. Values are averages of the means (n = 3) ± SD; ns, not significant.

