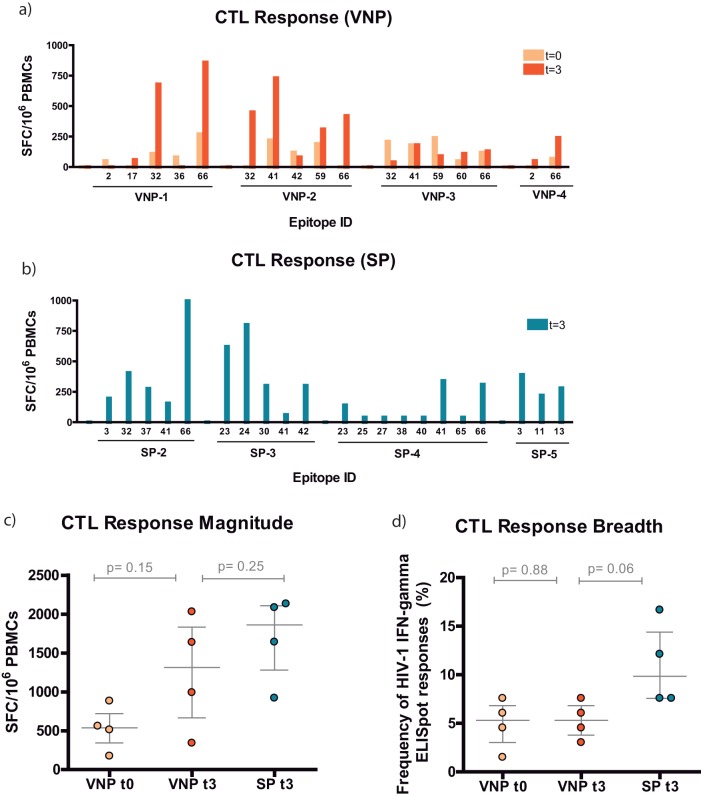
FIG 1.
Epitope-specific CTL response in VNPs and SPs. (a and b) Map of the specific overlapping epitopes that generated IFN-γ responses for VNPs and SPs, respectively. Data are presented as spot-forming cells (SFC) per 106 PBMCs. Specifically, for VNPs we were able to compare samples from t0 (light orange) with those from t3 (dark orange). (c) Specific CTL response magnitude. The magnitude of the response was the additive response of all the positive wells measured as SFC/106 PBMCs. VNP data are represented in light orange (t0) or dark orange (t3). SP data are presented in dark blue (t3). (d) Specific CTL response breadth.

