FIG 2.

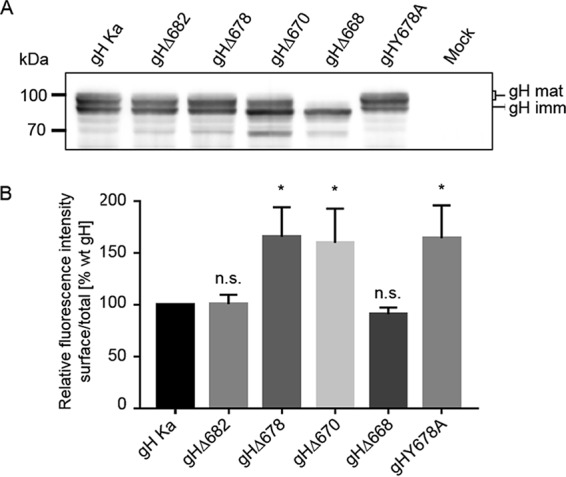
Expression and surface localization of gH truncation mutants. (A) Western blot analysis. Lysates prepared 48 h after transfection with expression plasmids for wild-type (gH Ka) or mutant gH in combination with gL or only the empty vector (mock) were separated by SDS-PAGE. Blots were probed for presence of mature (gH mat) and immature gH (gH imm). Molecular masses (kDa) of marker proteins are indicated on the left. (B) Flow cytometry. RK13 cells were transfected in parallel assays with expression plasmids for either wild-type or C-terminally truncated gH in combination with gL. After 24 h, cells were either permeabilized or not and then stained with a monoclonal antibody against gH and Alexa-Fluor 488-conjugated secondary antibodies, and fluorescence was measured. Bars represent the ratio between the mean fluorescence intensity (MFI) of cells expressing gH at the surface and MFI of total gH-positive cells. Results obtained for gH Ka were set as 100%. Mean values and standard deviations from three independent experiments are shown. Significance of differences from results obtained with wild-type gH is marked (*, P < 0.05). n.s., not significantly different from gH Ka.
