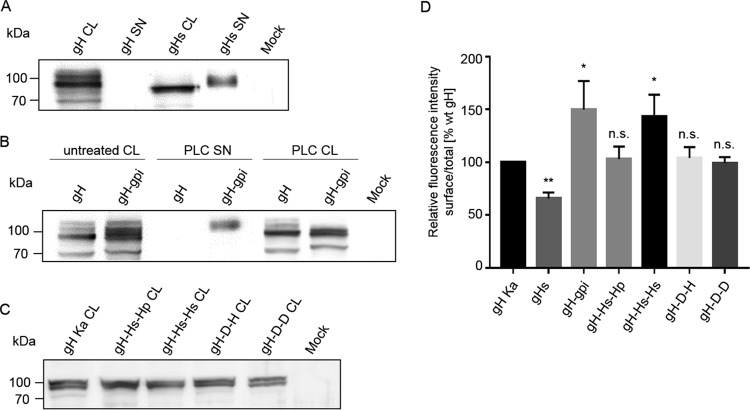
FIG 5.
Expression and surface localization of gHs, gH-gpi, and gH chimeras. Cell lysates (CL) or supernatants (SN) harvested 48 h after transfection with expression plasmids for wild-type gH Ka, gHs (A), gH-gpi (B), the different gH chimeras (C), or the empty vector (mock) were separated by SDS-PAGE. To test whether the predicted gH-gpi is membrane associated via the gpi anchor, wild-type gH and gH-gpi-expressing cells were treated with PLC. Supernatants and lysates of PLC-treated cells were separated by SDS-PAGE. Blots were incubated with a PrV gH-specific rabbit polyclonal antiserum. Molecular masses (kDa) of marker proteins are indicated. (D) Total and cell surface expression of wild-type gH and the gH mutants was analyzed by flow cytometry. Bars represent the ratio between the mean fluorescence intensity (MFI) of cells expressing gH at the surface and MFI of total gH-positive cells. Results obtained for gH Ka were set as 100%. Mean values and standard deviations for three independent experiments are shown. Significance of differences from results obtained with gH Ka is marked (*, P < 0.05; **, P < 0.01). n.s., not significantly different from gH Ka.

