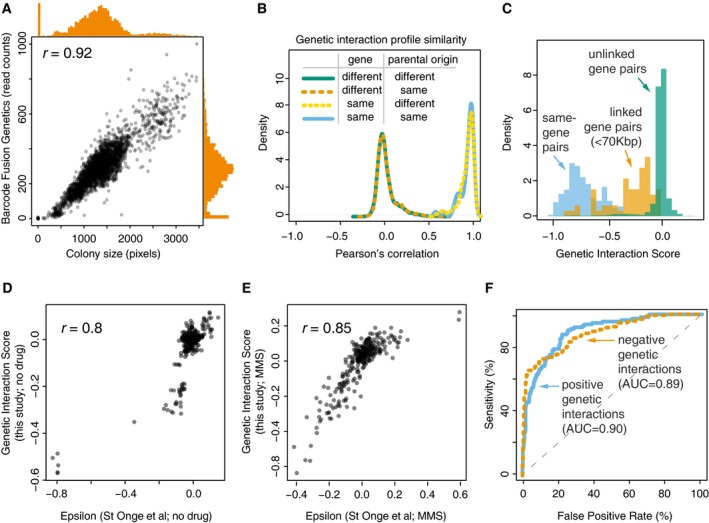
Figure 2. BFG‐GI quality control and benchmarking.

- Correlation between two measures of cell abundance (colony size and next‐generation‐sequencing‐based quantification of fused barcodes) for BFG‐GI double‐mutant strains. Histograms show distribution of abundance in the two measurements. Peaks in the histograms representing data points in the bottom‐left corner of the scatter plot indicate that absent and very small colonies produced few or no sequencing reads.
- Density plots for BFG‐GI genetic interaction score (GIS) correlation between replicates of the same gene, with same or different parental origin, or pairs of different genes. Only replicates with a GIS correlation > 0.5 were retained for further analyses.
- Histograms comparing the GIS distribution for “same‐gene pairs” (which are expected to behave like synthetic lethals given the SGA double‐mutant selection process) with that for linked‐ and unlinked‐gene pairs.
- Comparison of BFG‐GI‐inferred genetic interactions in haploid double‐mutant media without MMS with genetic interactions identified using similar media (St Onge et al, 2007).
- Comparison of BFG‐GI‐inferred genetic interactions in haploid double‐mutant media containing MMS with genetic interactions previously identified in similar media (St Onge et al, 2007).
- Benchmarking of BFG‐GI genetic interactions against the St. Onge et al (2007) dataset. Note that “false positives” may be real interactions that were not found in the benchmark study.
