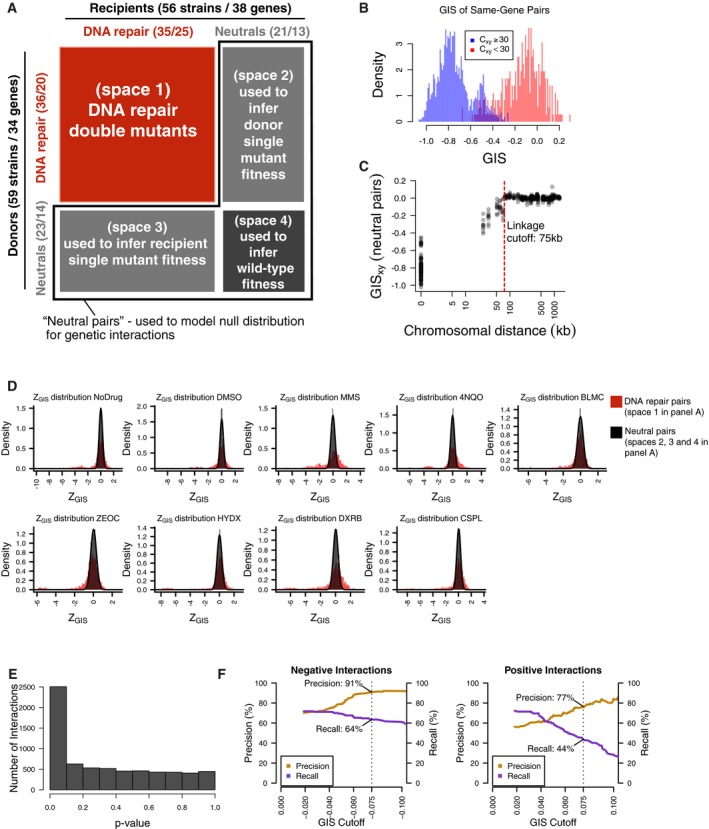
Figure EV4. Calling genetic interactions.

- Two collections of 59 donor strains (containing 34 unique knockouts) and 56 recipient strains (containing 38 unique gene knockouts) were crossed against each other in an all‐by‐all pooled format. Each strain contains a knockout at either a DNA repair gene or neutral locus. Double‐knockout strains were divided into four spaces based on the types of genes knocked out. Numbers in parentheses represent the number of strains and unique gene knockouts, respectively.
- Distribution of GIS amongst strain pairs containing the same gene, split by those which were well‐measured from the heterozygous diploid stage (C xy ≥ 30) and not well‐measured from the same stage (C xy < 30). Non‐well‐measured strains (72 out of 3,305) were excluded from analysis, and GIS was re‐calculated after their exclusion.
- Distribution of GIS in strains representing linked neutral pairs. Using the GIS profiles, an empirical cutoff of 75 kbp (red dashed line) was chosen to classify strains with knockout pairs on the same chromosome as either linked or unlinked. GIS was then re‐calculated based on this linkage criterion.
- Distribution of Z GIS calculated for DNA repair pairs (space 1 in panel A, red) and pairs involving well‐measured and unlinked neutral genes (spaces 2, 3, and 4 in panel A, black). Z GIS for pairs involving neutral genes were used to calculate a P‐value.
- Distribution of P‐values calculated by the null distribution in (D). P‐values were combined for multiple barcode replicates of each gene–gene pair and converted to FDR scores (see Materials and Methods). Barcode‐level P‐values are available in Table EV3, and gene‐level FDR scores are available in Table EV4.
- Benchmarks of BFG‐GI with data from St Onge et al (2007) for strains containing a significant genetic interaction (FDR < 0.01). Each graph shows precision and recall using the benchmark of St Onge et al (2007) as a function of an additional GIS effect‐size cutoff (left = negative interaction performance; right = positive interaction performance). Overlay text indicates performance at |GIS| = 0.075 (dashed lines), which was chosen as the effect‐size threshold.
