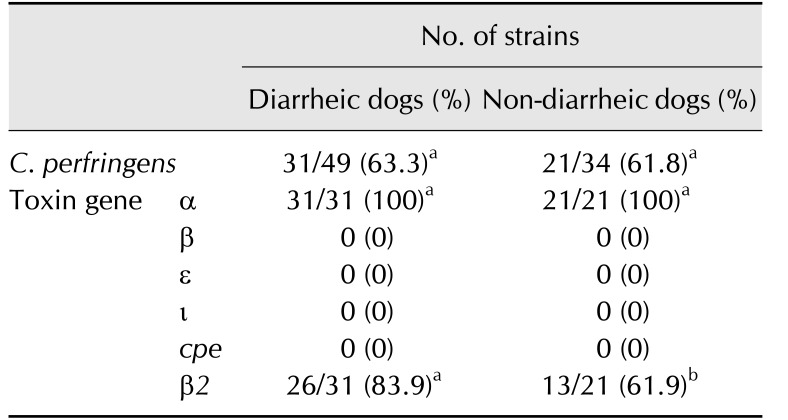
Table 2. The prevalence of Clostridium perfringens and toxin gene profiles.
Different superscript letters (a, b) within a row indicate a significant difference (p < 0.05) in the number of positive samples. The number of positives in diarrheic and non-diarrheic dogs was compared by using Fisher's exact test in GraphPad InStat software (ver. 3.05; GraphPad Software).

