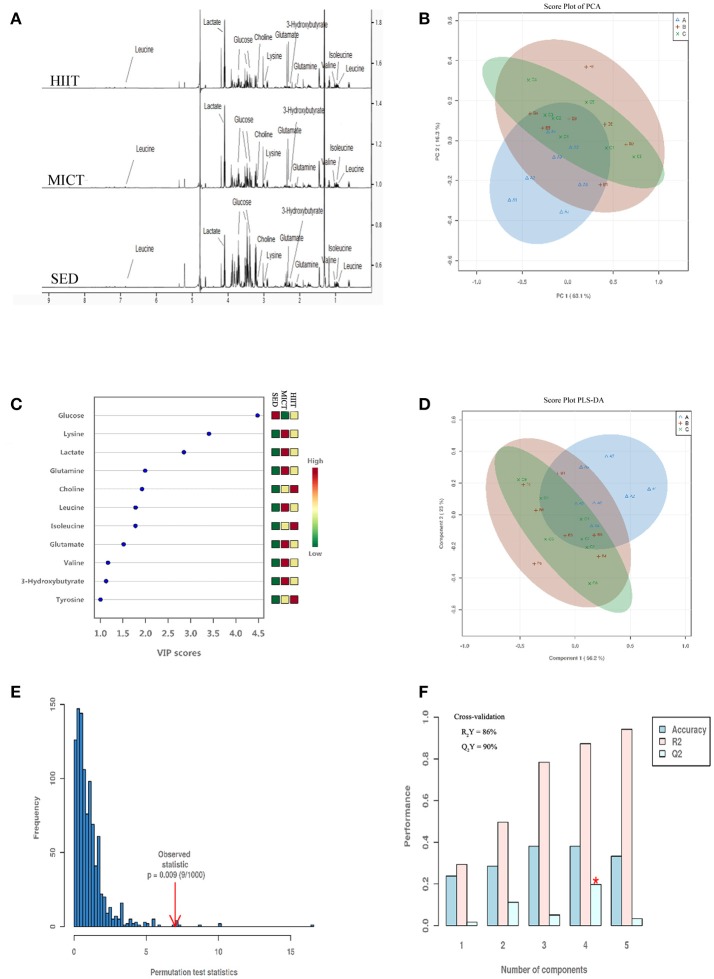
Figure 2.
Representative 600-MHz NMR spectra, score plot of principal component analysis (PCA), and model of partial least squares-discriminant analysis (PLS-DA) of all serum samples. NMR spectra (A), score plot of PCA (B) and VIP score (C), score plot of PLS-DA (D), the 100 permutations test (E), and cross-validation score plots of PLS-DA (F). Sedentary control (SED) is represented in blue Δ A; moderate-intensity continuous training (MICT) in red+B; high-intensity interval training (HIIT) in green × C in (B,D). On the right in (C), the levels (high-low) of metabolites in SED, MICT, and HIIT groups (n = 10) are represented.

