Figure 2.

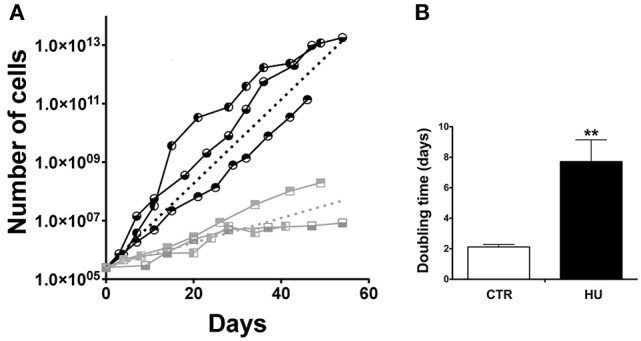
Growth curve and doubling time. (A) Proliferation capabilities comparison between CTR and HU samples. Each node of the curve represents a passage. The analysis was performed for 60 days of growth.  CTR1;
CTR1;  CTR2,
CTR2,  CTR3;
CTR3;  HU1;
HU1;  HU2;
HU2;  HU3. Dashed lines represent the average of CTR (black) and HU (gray). The average curves were built as the average of the slope of the CTR curves and HU curves with the constraint that the curve has value 250,000 at day 0. (B) Doubling time of proliferation expressed in days was calculated as the average of the doubling time of the single samples by means of non-linear fit regression. Black CTR, Gray HU. **p < 0.0089.
