
Figure 5.
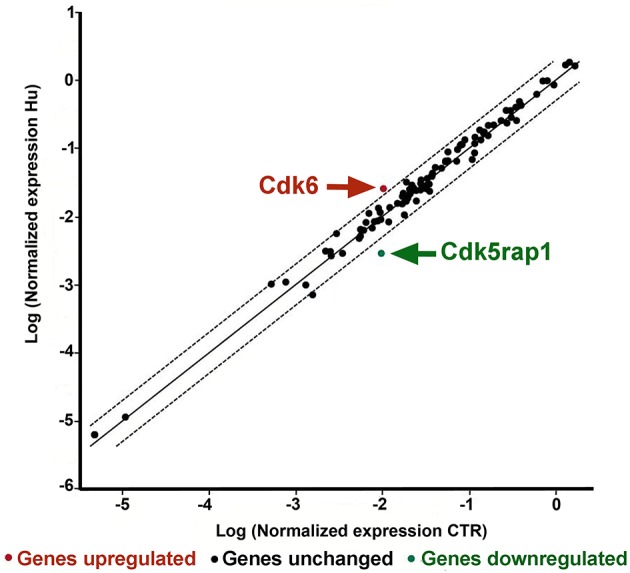
PCR Array analysis of CTR and HU samples. The scatter plot analyzes the normalized expression of all genes on the array between the two groups (CTR and HU) by plotting them against one another and indicating large gene expression alterations. The central line indicates unchanged gene expression whereas the dotted lines show the selected fold regulation threshold. Data points beyond the dotted lines in the upper left and lower right sections exceed the selected fold regulation threshold. The two genes that were observed to be significantly different between CTR and HU are indicated by arrows. (Controls = CTR, n = 7, and Hindlimb Unloading = HU, n = 4).