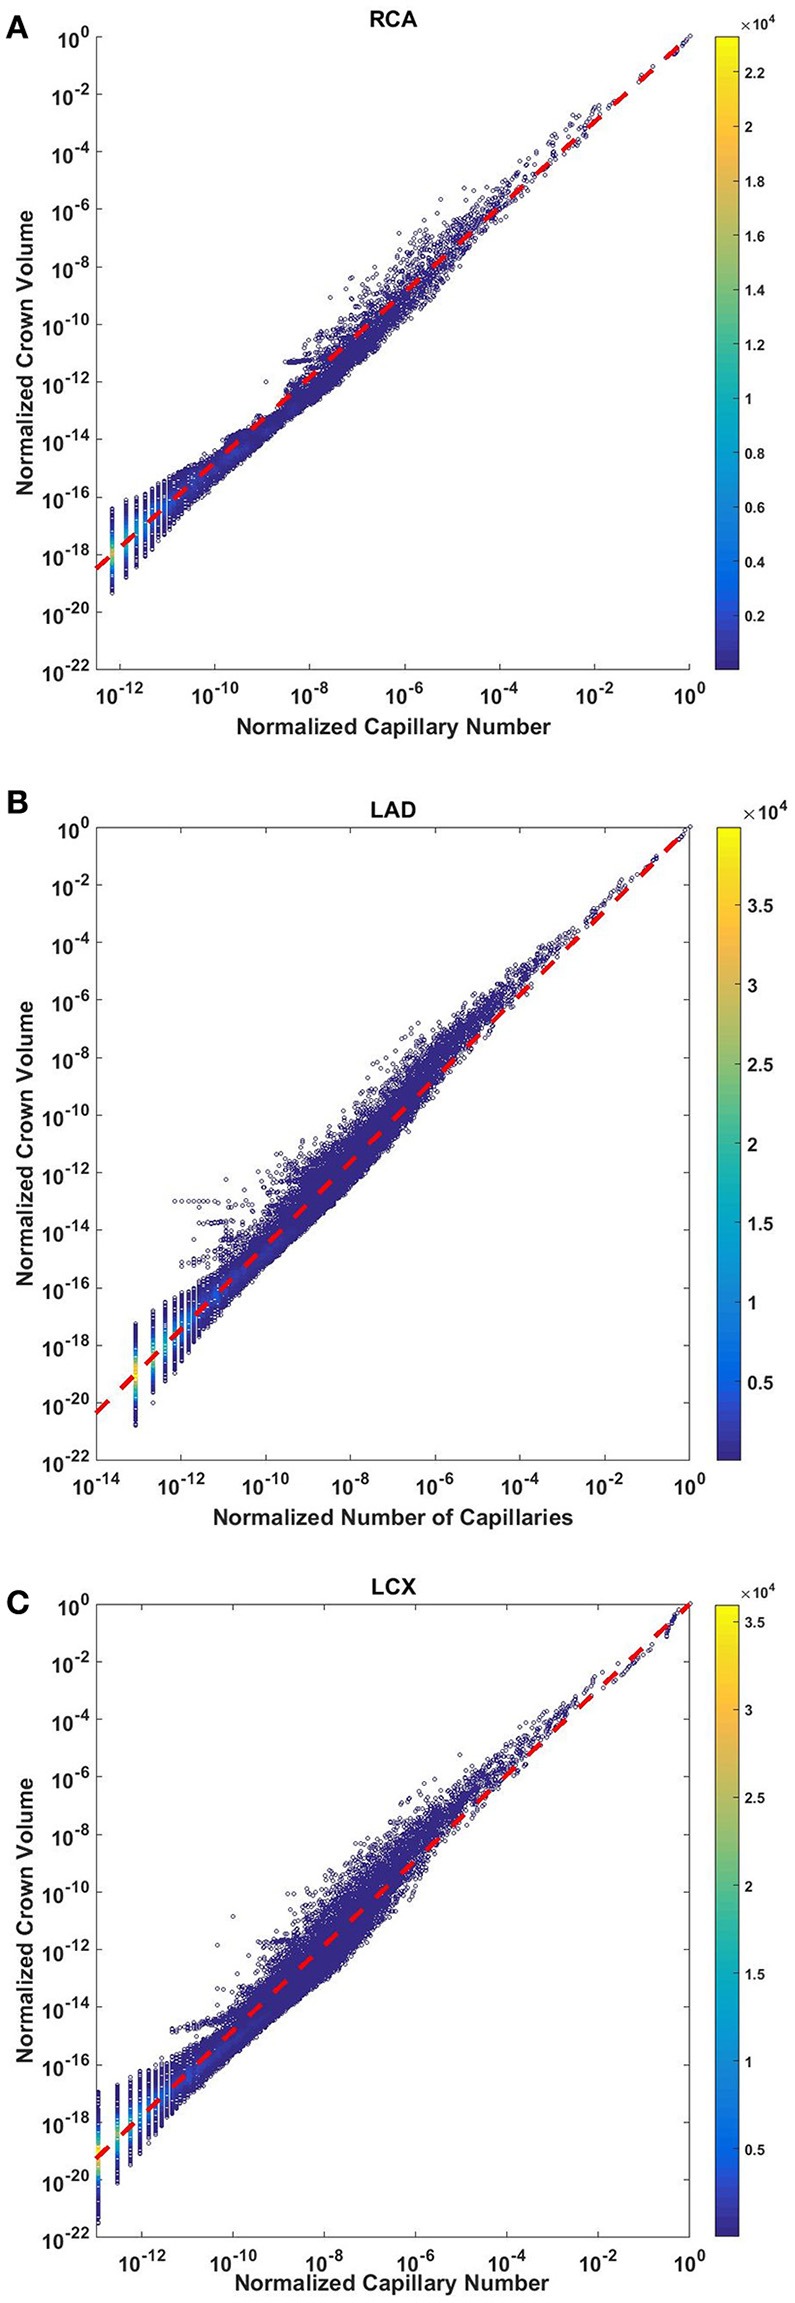
Figure 4.

Relationship between normalized crown volume (Vc/Vc,max) and normalized number of capillaries (Nc/Nc,max) for the full asymmetric porcine arterial tree shown in a log-log density plot: (A) RCA, right coronary artery; (B) LAD, left anterior descending artery; (C) LCx, left circumflex artery. The total number of data points shown in (A–C) are 838,462, 950,014, and 575,868; respectively. The scaling exponents obtained from the least square fit of each data set are close to 3/2. The values of exponents, the confidence interval and R2 for each species and organs are summarized in Table 2.
