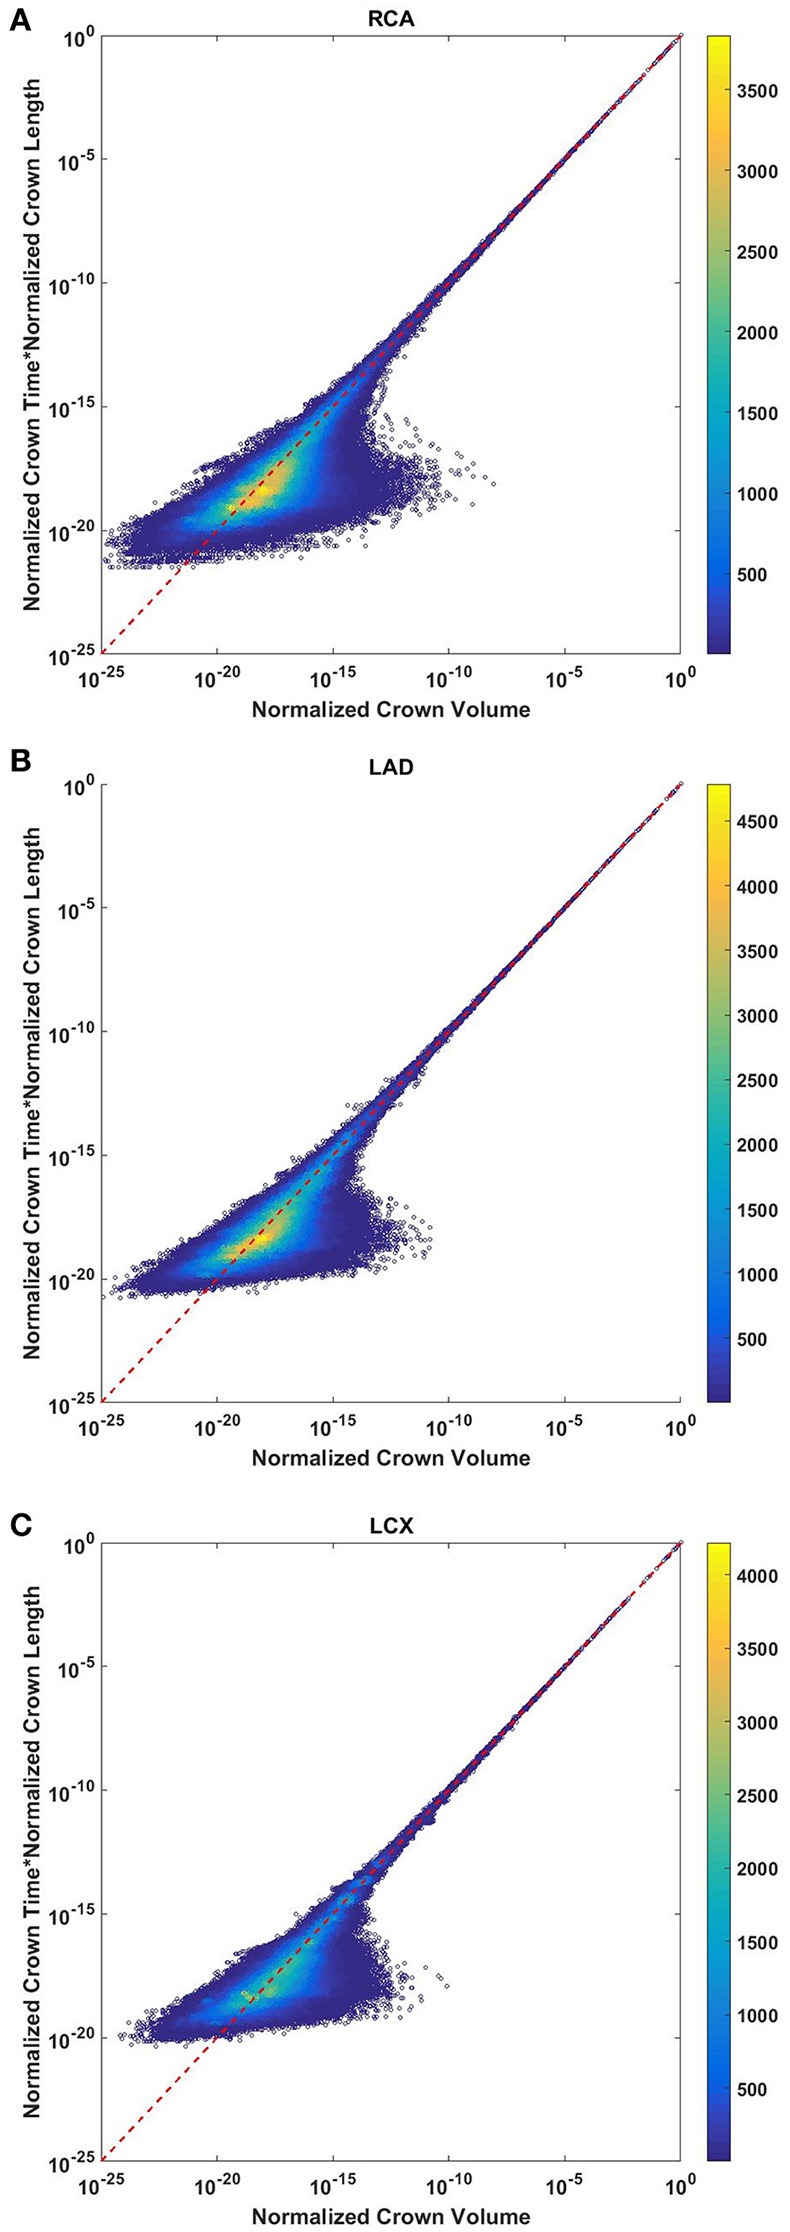
Figure 8.

Relationship between normalized crown volume (Vc/Vc,max) and multiplication of crown mean transit time and crown length (Ts/Ts,max* Ls/Ls,max) for the full asymmetric porcine arterial tree shown in a log-log density plot: (A) RCA, right coronary artery; (B) LAD, left anterior descending artery; (C) LCx, left circumflex artery. The total number of data points shown in (A–C) are 838,462, 950,014, and 575,868; respectively. The dash lines correspond to the theoretical exponent of unity. The scaling exponents obtained from the least square fit of each data set are close to the theoretical value of unity. The values of exponents, the confidence interval and R2 for each species and organs are summarized in Table 2.
