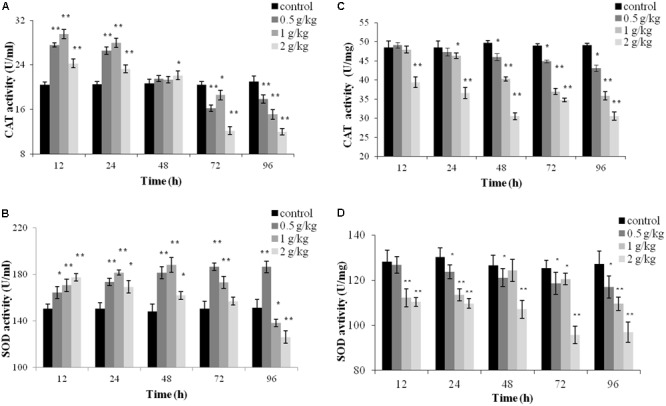
FIGURE 4.

Catalase (CAT) and superoxide dismutase (SOD) activities of Carassius auratus gibelio after a single dose of 0.5 g/kg, 1 g/kg, or 2 g/kg trichlorfon. (A) Changes in CAT activity in plasma after a single dose of trichlorfon; (B) changes in SOD activity in plasma after a single dose of trichlorfon; (C) changes in CAT activity in liver tissues after a single dose of trichlorfon; and (D) changes in SOD activity in liver tissues after a single dose of trichlorfon. Asterisks indicate values that are significantly different from the control values, ∗P < 0.05; ∗∗P < 0.01, n = 3.
