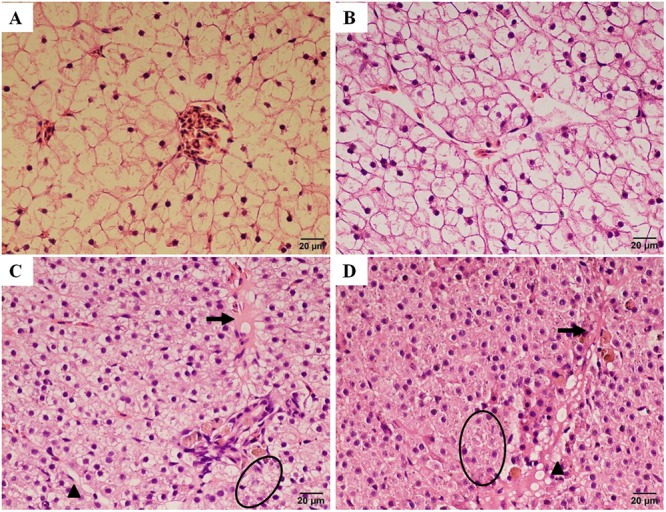
FIGURE 5.

Histopathological changes in the liver of Carassius auratus gibelio after treatment with trichlorfon for 24 h. (A) Liver of control fish; (B) liver of Carassius auratus gibelio after oral administration of 0.5 g/kg trichlorfon; (C) oral administration of 1 g/kg trichlorfon; and (D) oral administration of 2 g/kg trichlorfon. Vacuolar degeneration (triangle), necrosis (circle), and congestion of the central vein (arrow).
