Figure 1.

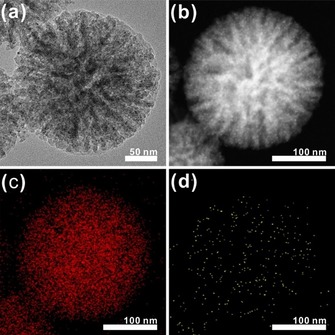
TEM images of DFNS/Au dots: a) bright‐field TEM image; b) dark‐field TEM image; c, d) EDS mapping elemental analysis showing the oxygen (c) and gold (d) content of the DFNS/Au dots.

TEM images of DFNS/Au dots: a) bright‐field TEM image; b) dark‐field TEM image; c, d) EDS mapping elemental analysis showing the oxygen (c) and gold (d) content of the DFNS/Au dots.