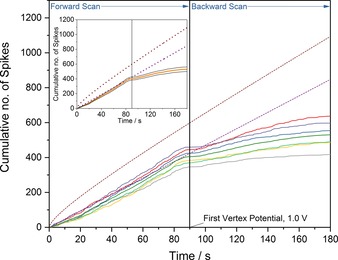
Figure 2.

Cumulative number of spikes recorded as a function of time with 12 pm AgNPs in 20 mm KBr (solid lines). Also depicted are the theoretically predicted cumulative number of spikes derived from the integrated Shoup–Szabo Equation (brown dashed line) and the predicted number derived assuming a steady‐state flux (purple dashed line). Inlay displays the mean number of cumulative spikes from the seven voltammograms (orange line) with the associated standard error (grey lines).
