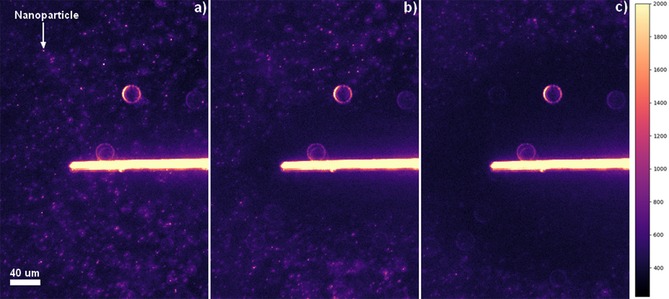
Figure 3.

Representative dark‐field microscopy images of a carbon fiber wire immersed in a suspension of 1.2 pm AgNPs in 20 mm KBr under 20 × magnification. Images at a) 0 s, b) 3.1 s, and c) 14.1 s during the double step chronoamperometry. The images are falsely colored using a magma color map, with the intensity characterized by the scale shown on the right.
