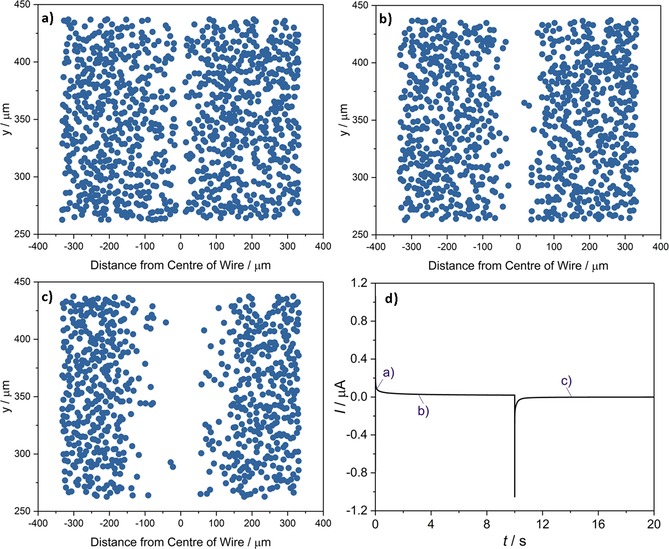
Figure 4.

NP tracking images of a carbon fiber wire immersed in 1.2 pm AgNPs in 20 mm KBr as a function of time: a) 0 s, b) 3.1 s, c) 14.1 s. d) The accompanying double potential step chronoamperogram, in which the potential was held at 1.3 V (vs. pseudo‐Ag) for 10 s, before being stepped to 0.0 V for 30 s.
