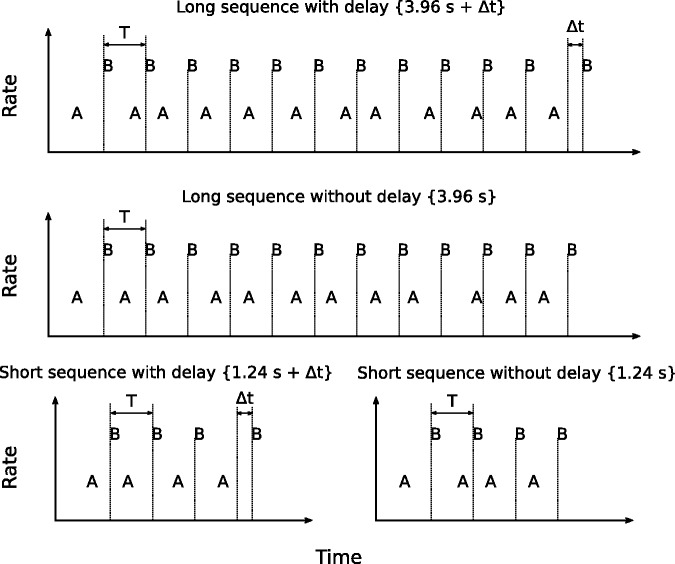
Figure 1.
Graphical representation of the experimental paradigm. T represents the onset-to-onset interval and Δt is the delay of the last B sound. The long sequence, with and without Δt, is shown in the upper and middle panels. The short sequence, with and without Δt, is illustrated in the lower left and lower right panels, respectively. The rate difference between A and B sounds varied across conditions.

