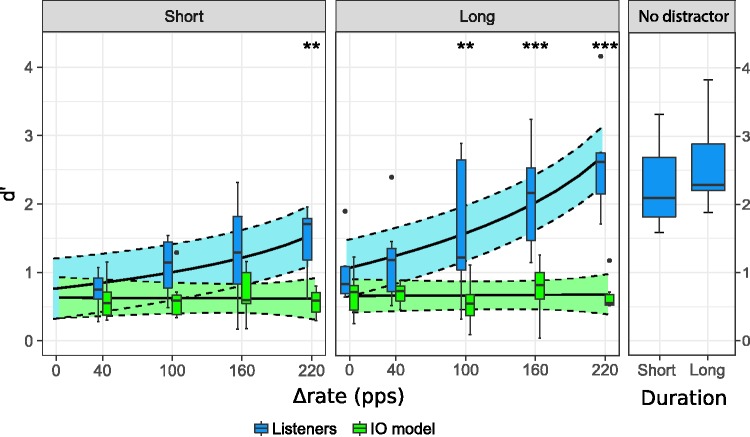
Figure 4.
Sensitivity (d′) scores to the delayed B sound for each Δrate and sequence duration. The control condition (no distractor) for both long and short sequences is shown in the rightmost panel. The boxes illustrate data from the listeners (blue) and the corresponding IO model predictions (green). The solid lines represent the lsmeans estimate from the statistical model. Its 95% confidence interval is indicated with dashed lines and the corresponding shaded area. A statistically significant difference between the IO model predictions and the listener’s data is indicated by one asterisk if .05 > p > .01, two asterisks if .01 > p > .001 and three asterisks if p < .001.

