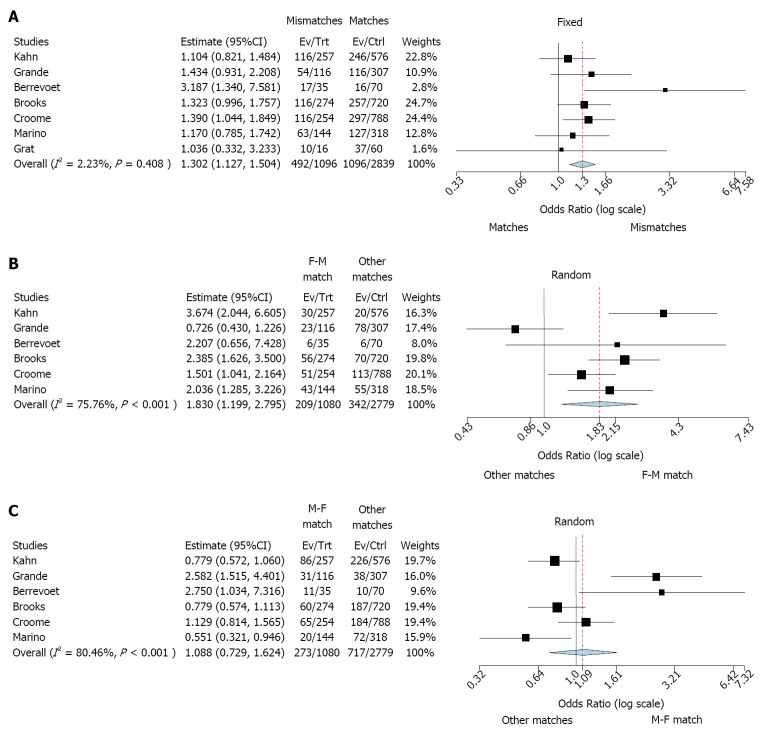
Figure 2.
Forest plot result. A: Forest plot of odds ratios and 95% confidence intervals for the association between any donor-to-recipient mismatch (F-M and M-F) and graft survival in patients undergoing liver transplantation. Weights are from binary fixed-effect analysis; B: Forest plot of odds ratios and 95% confidence intervals for the association between donor-to-recipient F-M mismatch and graft survival in patients undergoing liver transplantation. Weights are from binary random-effect analysis; C: Forest plot of odds ratios and 95% confidence intervals for the association between donor-to-recipient M-F mismatch and graft survival in patients undergoing liver transplantation. Weights are from binary random-effect analysis.

