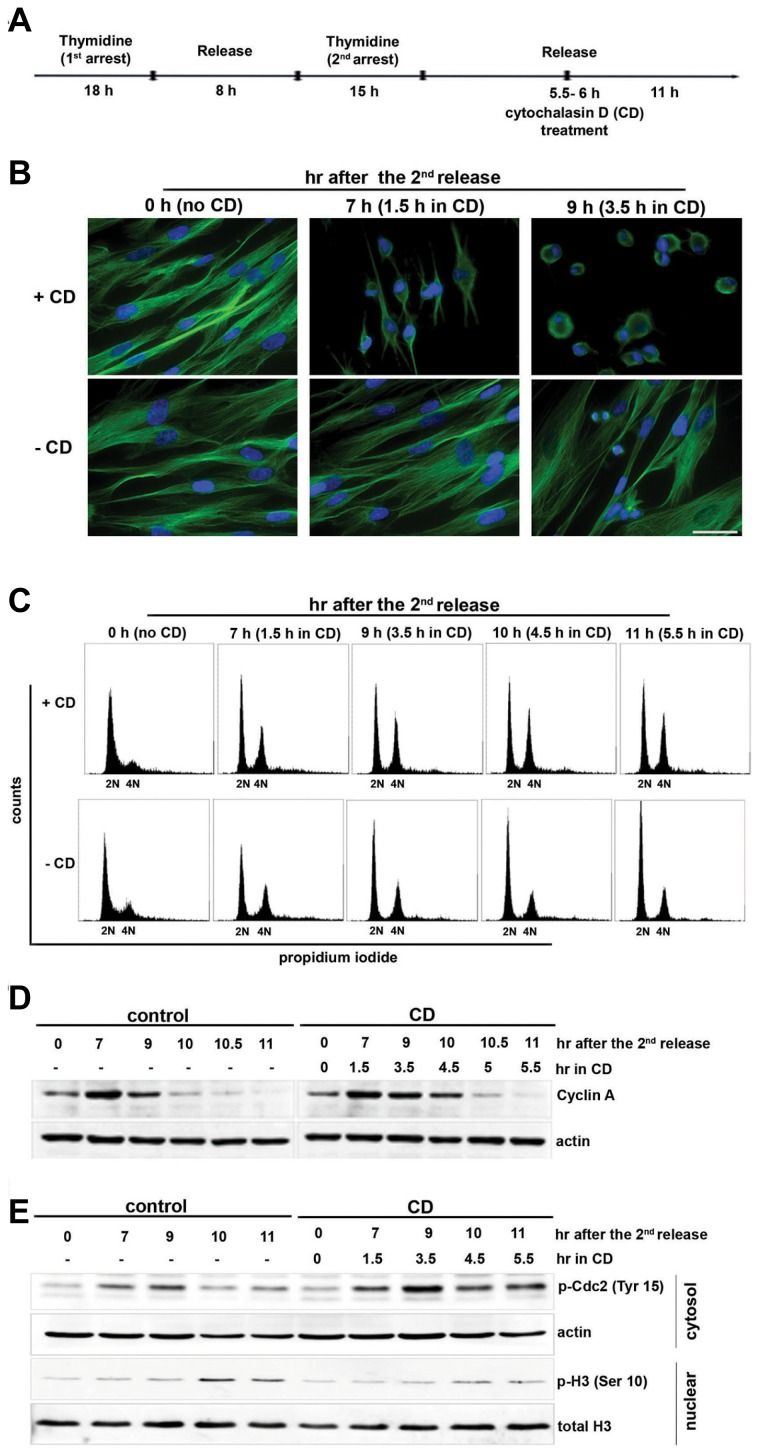
Fig. 1. Actin disruption delays cell cycle at G2/M transition in normal IMR-90 cells.
(A) The layout shows how the experiment was designed and performed. IMR-90 cells were synchronized with 2 mM double thymidine arrest. The cells were treated with 5 μM cytochalasin D (CD) or the solvent DMSO as a control at 5.5–6 h after the second release and were collected at each indicated time point after the second release. (B) CD-treated and CD-untreated control cells were immunostained with an antibody against α-tubulin as described in the Materials and Methods. Nuclei were counterstained with DAPI. Scale bar, 50 μm. (C) Cells were fixed, stained with PI (10 μg/ml), and processed for flow cytometry. For each analysis, 10,000 cells were counted, and each fraction of cells with 2N and 4N DNA content is shown. (D) The cell lysate was resolved by 8% SDS-PAGE and blotted with anti-cyclin A and reprobed with anti-actin. (E) Histone extraction was performed as described in the “Materials and Methods”. The cytosolic fraction and histone fraction was resolved by 12% SDS-PAGE and blotted with p-Cdc2 (Tyr 15) and p-H3 Ser 10, respectively. Actin and histone H3 were used as loading controls.

