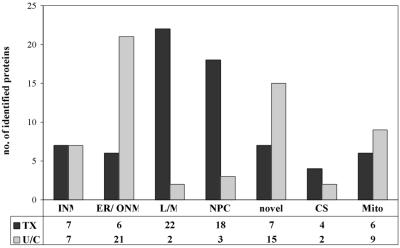
Figure 2.
Distribution of NE proteins on the different fractions. Selected proteins detected in the TX-100-resistant NE fraction (Tx) and in the chaotrope-resistant fraction (U/C) grouped according to their subcellular localization. See also Tables 5 and 6 for the identity of the proteins. INM, inner nuclear membrane; ER/ONM, endoplasmic reticulum/outer nuclear membrane; L/M, nuclear lamina and attached protein scaffold; NPC, nuclear pore complex; CS, cytoskeleton; Mito, mitochondria. Note the differences in the distribution of ER/ONM proteins, L/M proteins, and NPC proteins.

