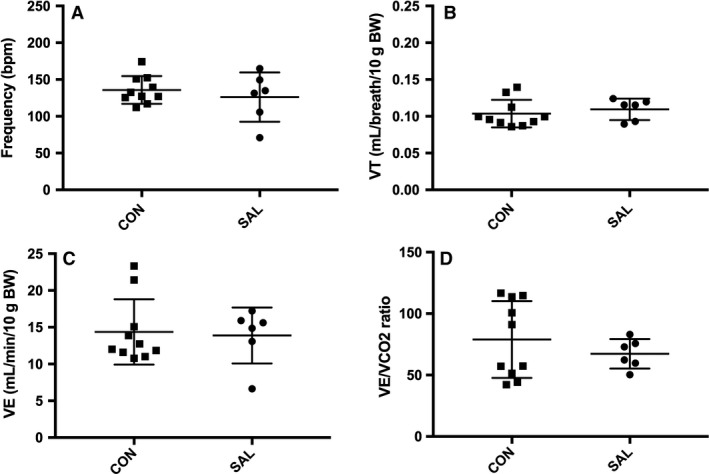
Figure 2.

Model 1 10‐min average of ventilatory measures in room air for SAL (7‐days saline administration; n = 7) and CON (n = 11) groups. No significant differences for (A) Frequency, (B) Tidal volume (VT), (C) Minute ventilation (VE), and (D) VE/VCO2 ratio where P > 0.05. Extreme outliers as defined by ≥2SD above mean were removed from data set. Values are expressed as mean ± SD.
