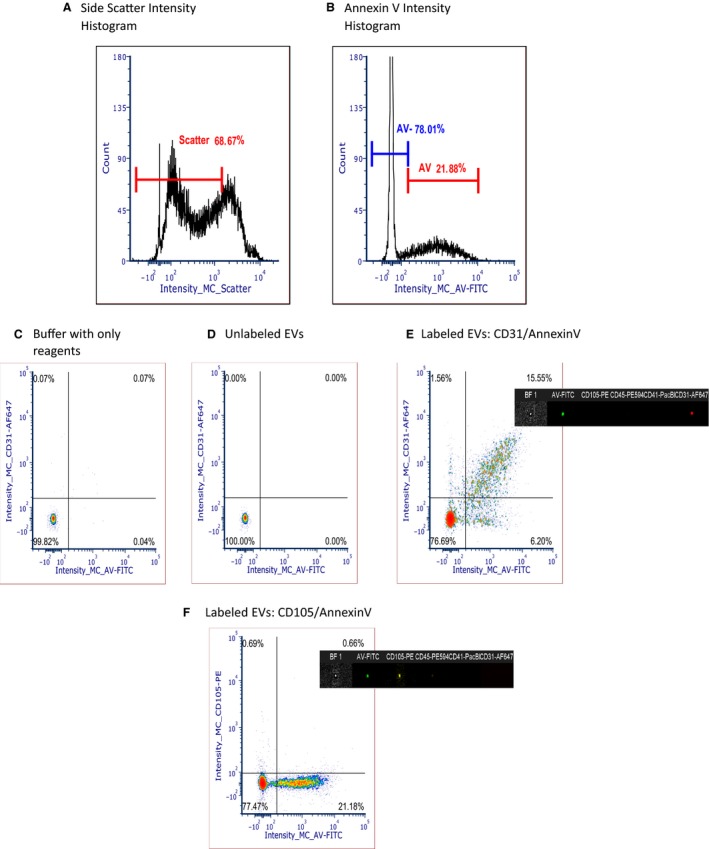
Figure 1.

EV Phenotyping with Imaging Flow Cytometry. Gating strategy based on low scatter (A) and Annexin V intensity positivity (B) on intensity histogram according to our previous published methods, (C) and (D) Controls: Buffer with only reagents, no EVs (C) unlabeled EVs without reagents (D). Example of dot plots of EV labeling: (E): CD31/Annexin V density plot and (F) CD105/Annexin V density plot.
