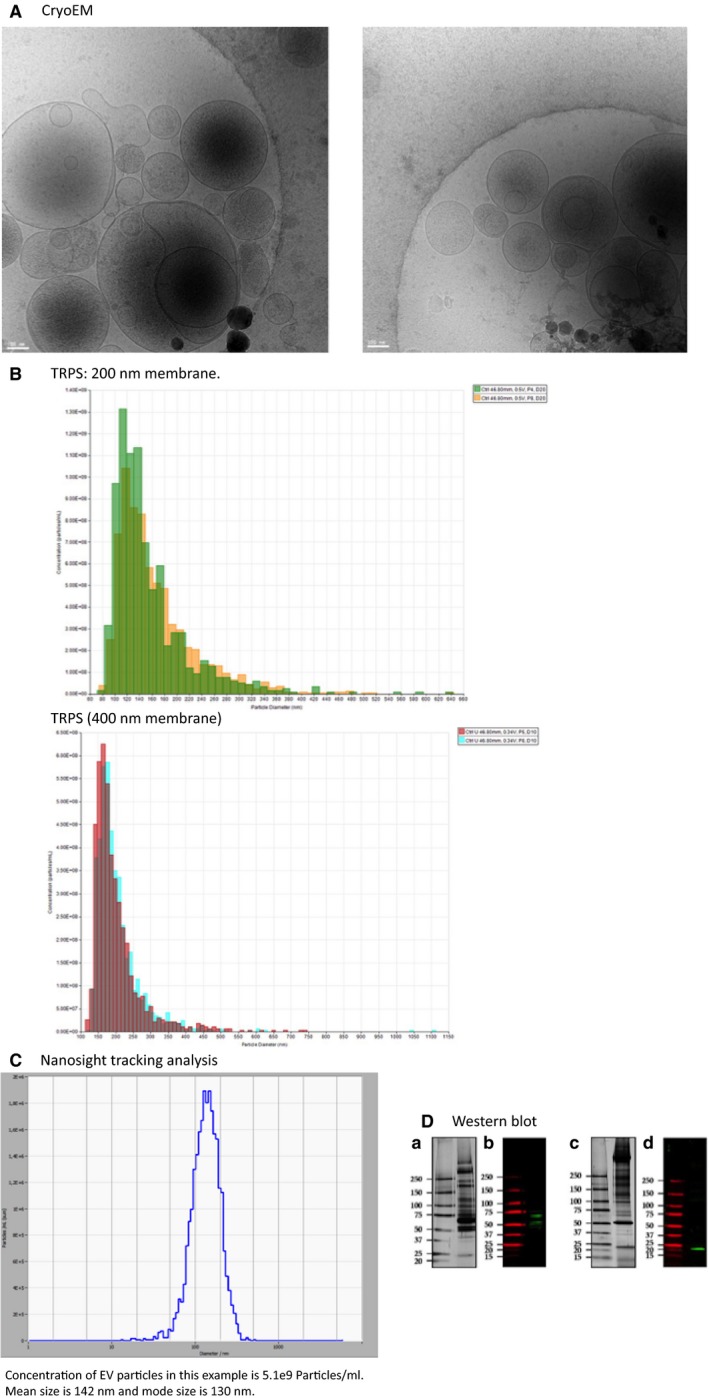
Figure 2.

Characterization of EV size, concentration, and morphology. Cryo‐electron microscopy images of EVs of different sizes (<100 nm to 1000 nm) (A); Tunable resistive pulse sensing (TRPS, qNano® by Izon, using 200 nm and 400 nm with 2 pressures). Concentration of EV particles in this example using a 200 nm pore size for qNANO with two pressures at 4A and 8A is 5.7e9 Particles/ml. Mean size is 161 nm and mode size is 116 nm taking average of both pressure measurement. Concentration of EV particles in the same example using a 400 nm pore size for qNANO with 2 pressures at 5A and 8A is 4.5e9 Particles/mL. Mean size is 203 nm and mode size is 170 nm taking average of both pressure measurements (B). Particle tracking of EVs with Nanosight tracking analysis (Zetaview® by Particle Metrix). Concentration of EV particles in this example is 5.1e9 particles/mL. Mean size is 142 nm and mode size is 130 nm (C); Western blotting of vesicle proteins. A (protein pattern) and B (Western blotting) show vesicle protein TSG101 in reducing condition and C (protein pattern) and D (Western blotting) show vesicle protein CD9 in nonreducing condition at expected band length (D).
