
Figure 2.
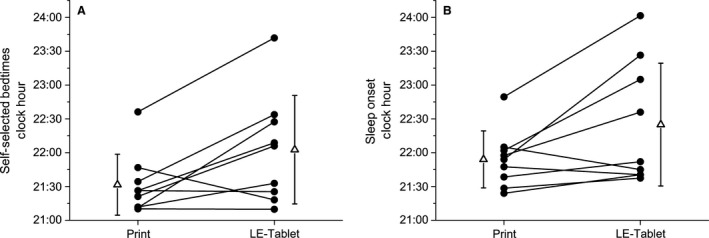
Self‐selected bedtimes and sleep onset times. Clock hour of (A) average self‐selected bedtime for all Print and LE‐tablet condition nights and (B) sleep onset during the fifth Print and LE‐tablet condition nights. In both panels, individual participant data are shown in black circles and condition group data (mean ± SD) are shown in open triangles beside the individual participant data. In (A), participants self‐selected significantly later average bedtimes on LE‐tablet nights compared to Print nights (Print: 21:32 ± 00:27 h; LE‐tablet: 22:03 ± 00:48 h, t 8 = 2.63; P = 0.030; d = 0.88). In (B), participants fell asleep significantly later on the fifth LE‐tablet condition night compared to the fifth Print condition night (Print: 21:54 ± 00:25 h; LE‐tablet: 22:25 ± 00:54 h, t 8 = 2.43; P = 0.041; d = 0.81).