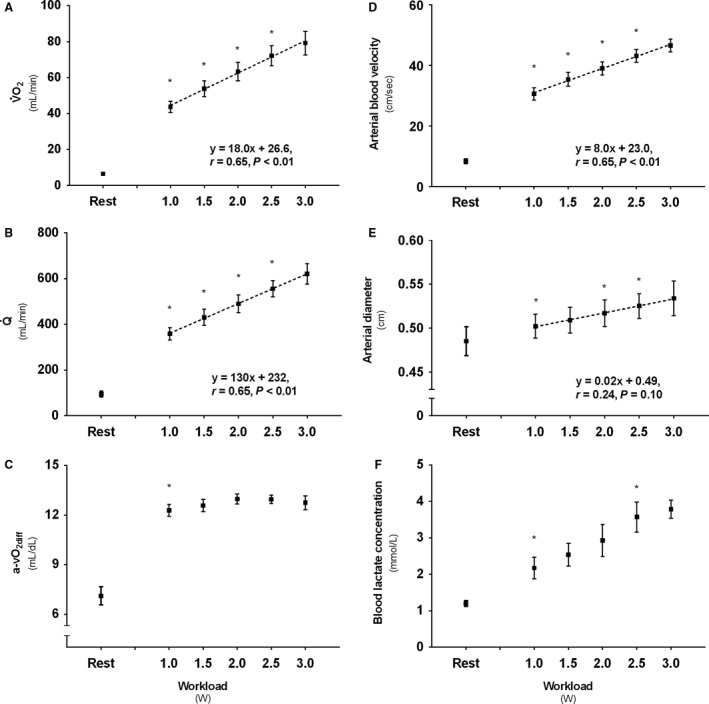
Figure 2.

Descriptive values for (A) Forearm oxygen uptake (O2), (B) Brachial artery blood flow (), (C) Arteriovenous oxygen difference (a‐vO2diff), (D) Brachial artery mean blood velocity, (E) Brachial artery diameter, and (F) Forearm venous lactate concentration following 3 min incremental steps of exercise intensity. * Denotes significant (P < 0.05) increase from previous condition. Boxes represent mean values from test and retest, with standard error of the mean (SEM).
