Figure 1.
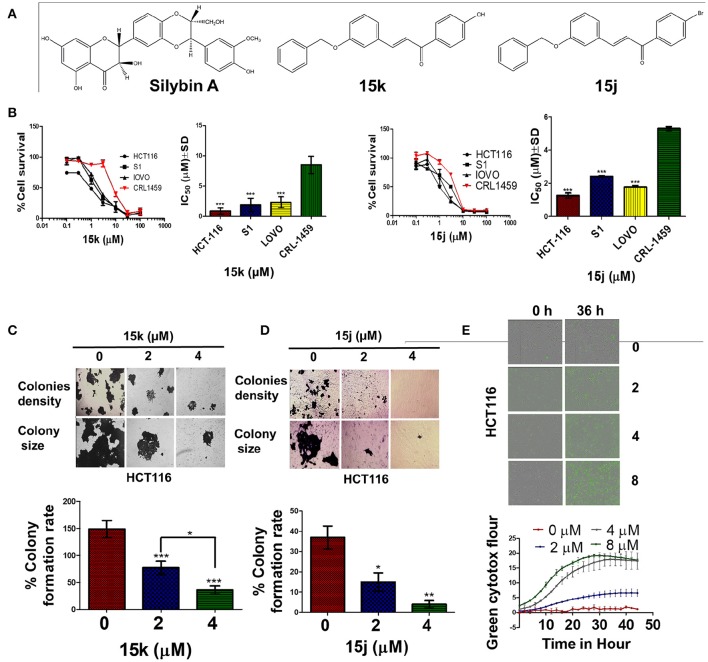
The selectivity and cytotoxicity of 15k, 15j on colon cancer cell lines; (A) The chemical structures of silybin A and the two potential lead silybin derivatives 15k, 15j; (B) Survival of colon cancer cells (HCT116, S1, LOVO) compared to that of normal colon cells (CRL1459); IC50 Values of 15k, 15j respectively on colon cancer cells (HCT116, S1, LOVO) compared to that of normal colon cells (CRL1459); Cell survival was determined by the MTT assay. IC50 values are represented as means ± SD of three independent experiments performed in triplicate. Statistically, ***P < 0.001; (C,D) Colony formation assay with quantification of colony number represented as colony formation rate. HCT116 CRC cancer cells were incubated with different concentrations (0, 2, 4 μM) of 15k and15j. The pictures show the effect of 15k (C), and 15j (D) on colony formation in whole well, colonies density, and colony size; a bar graph summarizing the results for 15k and 15j, respectively. The results are represented as means ± SD of three independent experiments with *p < 0.05, **p < 0.01, ***p < 0.001. (E) Green cytotox (green fluorescence) to quantify cell proliferation and death; Representative pictures of the fluorescence level green cytotox at the 0 and 36 h time points; time line curve quantitatively summarizing the results is also shown. The data are presented as the means ± SEM of three independent studies.

