Figure 5.

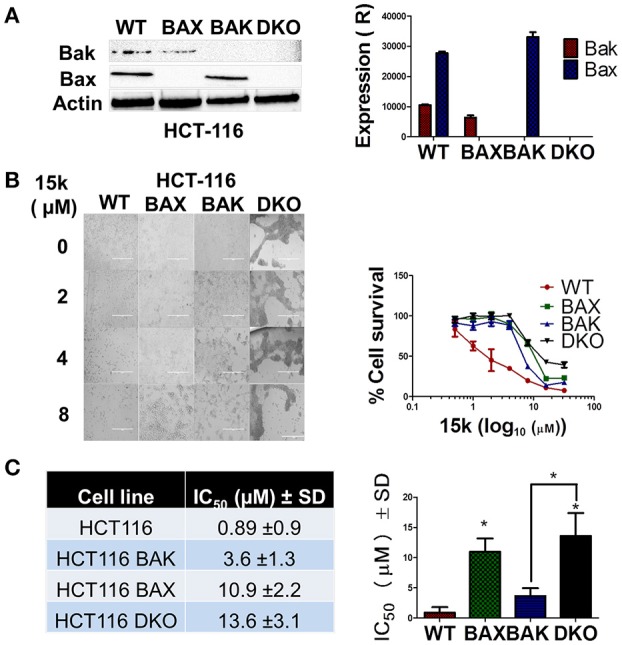
Wild type HCTT16 cells are more sensitive to 15k compared to knockout cells; (A) Western blot analysis showing the lack of expression of apoptotic proteins (Bak and Bax) in the HCT116 knock out cell lines (WT, Bak–/–, Bax–/–, and Bak-Bax–/–) to verify the knockout in the different cell lines. A bar graph summarizing the results is also shown; (B) Morphological analysis, using an EVOS microscope (at 20X) of the cytotoxic effects of 15k (0, 1, 5, and 10 μM) on HCT116 cell lines with different apoptotic genes knocked out 68 h after incubation. The cells were photographed for each triplicate treatment with an EVOS microscope. A survival curve of HCT116 knockout cells compared to wild type cells is also shown (C) IC50 Values of 15k for HCT116 knockout cells compared to wild type cells (WT). A bar graph comparing the IC50 values on different cells is also shown. Cell viability was determined using the MTT assay. IC50 values are represented as means ± SD of three independent experiments performed in triplicate with *p < 0.05.
